Mongolian vs French Canadian Unemployment Among Ages 20 to 24 years
COMPARE
Mongolian
French Canadian
Unemployment Among Ages 20 to 24 years
Unemployment Among Ages 20 to 24 years Comparison
Mongolians
French Canadians
9.9%
UNEMPLOYMENT AMONG AGES 20 TO 24 YEARS
99.1/ 100
METRIC RATING
68th/ 347
METRIC RANK
10.2%
UNEMPLOYMENT AMONG AGES 20 TO 24 YEARS
77.5/ 100
METRIC RATING
147th/ 347
METRIC RANK
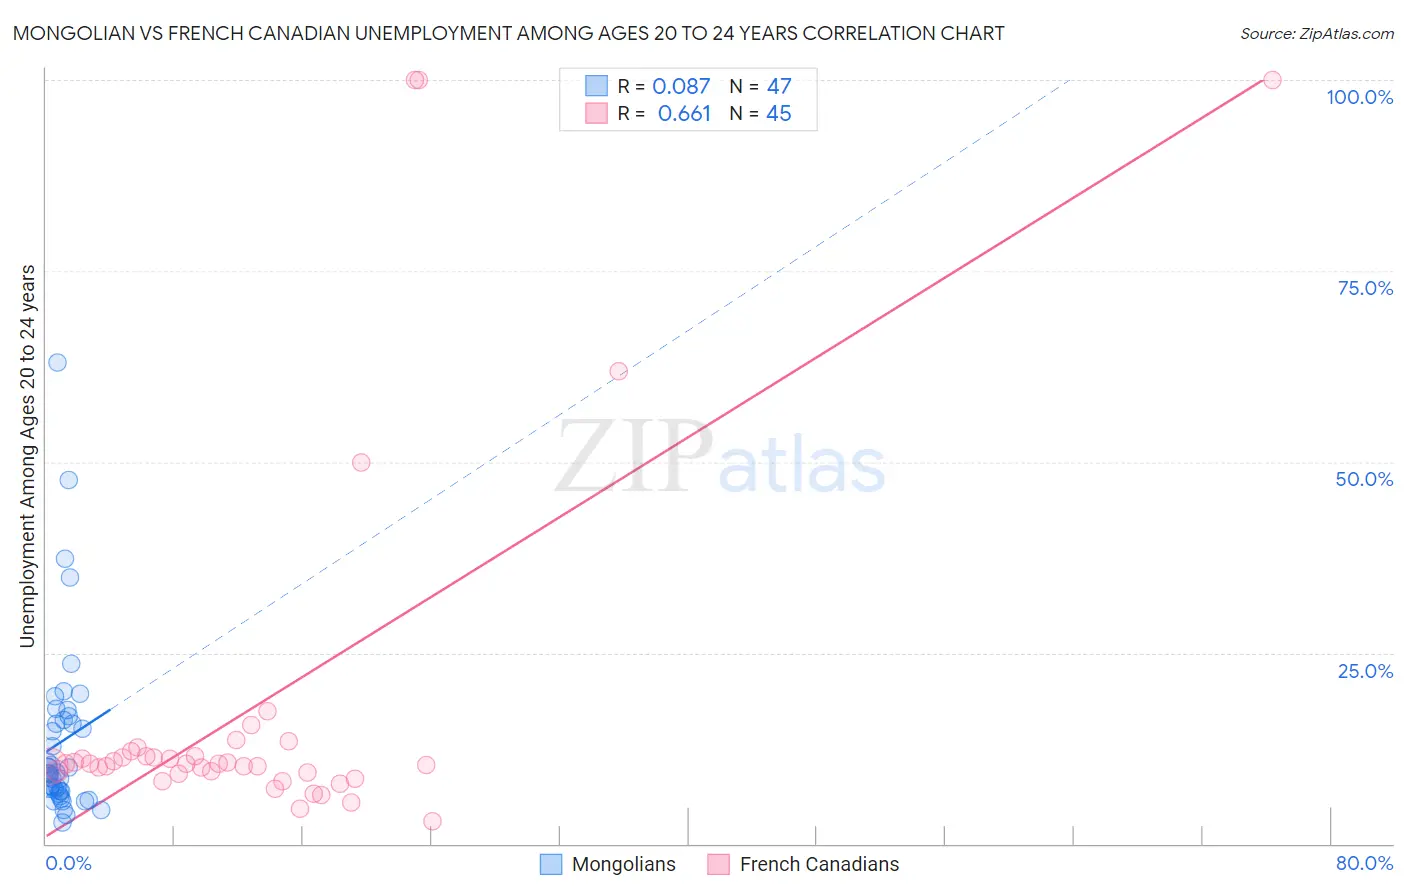
Mongolian vs French Canadian Unemployment Among Ages 20 to 24 years Correlation Chart
The statistical analysis conducted on geographies consisting of 139,247,610 people shows a slight positive correlation between the proportion of Mongolians and unemployment rate among population between the ages 20 and 24 in the United States with a correlation coefficient (R) of 0.087 and weighted average of 9.9%. Similarly, the statistical analysis conducted on geographies consisting of 471,883,331 people shows a significant positive correlation between the proportion of French Canadians and unemployment rate among population between the ages 20 and 24 in the United States with a correlation coefficient (R) of 0.661 and weighted average of 10.2%, a difference of 3.4%.
Unemployment Among Ages 20 to 24 years Correlation Summary
| Measurement | Mongolian | French Canadian |
| Minimum | 2.8% | 3.0% |
| Maximum | 63.0% | 100.0% |
| Range | 60.1% | 97.0% |
| Mean | 13.4% | 18.1% |
| Median | 9.2% | 10.4% |
| Interquartile 25% (IQ1) | 6.8% | 9.3% |
| Interquartile 75% (IQ3) | 16.3% | 11.8% |
| Interquartile Range (IQR) | 9.5% | 2.5% |
| Standard Deviation (Sample) | 11.6% | 24.3% |
| Standard Deviation (Population) | 11.5% | 24.0% |
Similar Demographics by Unemployment Among Ages 20 to 24 years
Demographics Similar to Mongolians by Unemployment Among Ages 20 to 24 years
In terms of unemployment among ages 20 to 24 years, the demographic groups most similar to Mongolians are Immigrants from Bolivia (9.9%, a difference of 0.050%), Bulgarian (9.9%, a difference of 0.080%), Scottish (9.8%, a difference of 0.17%), Immigrants from Croatia (9.9%, a difference of 0.20%), and Celtic (9.9%, a difference of 0.23%).
| Demographics | Rating | Rank | Unemployment Among Ages 20 to 24 years |
| Malaysians | 99.5 /100 | #61 | Exceptional 9.8% |
| Immigrants | Singapore | 99.4 /100 | #62 | Exceptional 9.8% |
| British | 99.4 /100 | #63 | Exceptional 9.8% |
| Serbians | 99.4 /100 | #64 | Exceptional 9.8% |
| Welsh | 99.3 /100 | #65 | Exceptional 9.8% |
| Scottish | 99.3 /100 | #66 | Exceptional 9.8% |
| Immigrants | Bolivia | 99.2 /100 | #67 | Exceptional 9.9% |
| Mongolians | 99.1 /100 | #68 | Exceptional 9.9% |
| Bulgarians | 99.1 /100 | #69 | Exceptional 9.9% |
| Immigrants | Croatia | 99.0 /100 | #70 | Exceptional 9.9% |
| Celtics | 98.9 /100 | #71 | Exceptional 9.9% |
| Bolivians | 98.9 /100 | #72 | Exceptional 9.9% |
| Kenyans | 98.7 /100 | #73 | Exceptional 9.9% |
| Immigrants | Laos | 98.7 /100 | #74 | Exceptional 9.9% |
| Immigrants | Australia | 98.6 /100 | #75 | Exceptional 9.9% |
Demographics Similar to French Canadians by Unemployment Among Ages 20 to 24 years
In terms of unemployment among ages 20 to 24 years, the demographic groups most similar to French Canadians are Asian (10.2%, a difference of 0.010%), Argentinean (10.2%, a difference of 0.030%), Brazilian (10.2%, a difference of 0.040%), Immigrants from Jordan (10.2%, a difference of 0.080%), and Immigrants from Romania (10.2%, a difference of 0.090%).
| Demographics | Rating | Rank | Unemployment Among Ages 20 to 24 years |
| Immigrants | Austria | 81.4 /100 | #140 | Excellent 10.2% |
| Immigrants | Azores | 81.4 /100 | #141 | Excellent 10.2% |
| Slovaks | 80.2 /100 | #142 | Excellent 10.2% |
| Immigrants | Jordan | 79.0 /100 | #143 | Good 10.2% |
| Brazilians | 78.4 /100 | #144 | Good 10.2% |
| Argentineans | 78.0 /100 | #145 | Good 10.2% |
| Asians | 77.7 /100 | #146 | Good 10.2% |
| French Canadians | 77.5 /100 | #147 | Good 10.2% |
| Immigrants | Romania | 75.7 /100 | #148 | Good 10.2% |
| Immigrants | Scotland | 74.6 /100 | #149 | Good 10.2% |
| Hungarians | 74.4 /100 | #150 | Good 10.2% |
| Immigrants | South Africa | 73.6 /100 | #151 | Good 10.2% |
| Iranians | 72.4 /100 | #152 | Good 10.2% |
| Immigrants | Taiwan | 71.4 /100 | #153 | Good 10.2% |
| Immigrants | Switzerland | 71.3 /100 | #154 | Good 10.2% |