Mexican vs Immigrants from Northern Africa Unemployment Among Ages 16 to 19 years

COMPARE

Mexican
Race
Ancestry
AfghanAfricanAlaska NativeAlaskan AthabascanAlbanianAleutAlsatianAmericanApacheArabArapahoArgentineanArmenianAssyrian/Chaldean/SyriacAustralianAustrianBahamianBangladeshiBarbadianBasqueBelgianBelizeanBermudanBhutaneseBlackfeetBolivianBrazilianBritishBritish West IndianBulgarianBurmeseCajunCambodianCanadianCape VerdeanCarpatho RusynCelticCentral AmericanCentral American IndianCherokeeCheyenneChickasawChileanChineseChippewaChoctawColombianColvilleComancheCosta RicanCreeCreekCroatianCrowCubanCypriotCzechCzechoslovakianDanishDelawareDominicanDutchDutch West IndianEastern EuropeanEcuadorianEgyptianEnglishEstonianEthiopianEuropeanFijianFilipinoFinnishFrenchFrench American IndianFrench CanadianGermanGerman RussianGhanaianGreekGuamanian/ChamorroGuatemalanGuyaneseHaitianHmongHonduranHopiHoumaHungarianIcelanderIndian (Asian)IndonesianInupiatIranianIraqiIrishIroquoisIsraeliItalianJamaicanJapaneseJordanianKenyanKiowaKoreanLaotianLatvianLebaneseLiberianLithuanianLumbeeLuxembourgerMacedonianMalaysianMalteseMarshalleseMenomineeMexicanMexican American IndianMongolianMoroccanNative HawaiianNavajoNepaleseNew ZealanderNicaraguanNigerianNorthern EuropeanNorwegianOkinawanOsageOttawaPaiutePakistaniPalestinianPanamanianParaguayanPennsylvania GermanPeruvianPimaPolishPortuguesePotawatomiPuebloPuerto RicanPuget Sound SalishRomanianRussianSalvadoranSamoanScandinavianScotch-IrishScottishSeminoleSenegaleseSerbianShoshoneSierra LeoneanSiouxSlavicSlovakSloveneSomaliSouth AfricanSouth AmericanSouth American IndianSoviet UnionSpaniardSpanishSpanish AmericanSpanish American IndianSri LankanSubsaharan AfricanSudaneseSwedishSwissSyrianTaiwaneseThaiTlingit-HaidaTohono O'OdhamTonganTrinidadian and TobagonianTsimshianTurkishU.S. Virgin IslanderUgandanUkrainianUruguayanUteVenezuelanVietnameseWelshWest IndianYakamaYaquiYugoslavianYumanYup'ikZimbabwean
Immigration
NonimmigrantsImmigrantsAfghanistanAfricaAlbaniaArgentinaArmeniaAsiaAustraliaAustriaBahamasBangladeshBarbadosBelarusBelgiumBelizeBoliviaBosnia and HerzegovinaBrazilBulgariaBurma/MyanmarCabo VerdeCambodiaCameroonCanadaCaribbeanCentral AmericaChileChinaColombiaCongoCosta RicaCroatiaCubaCzechoslovakiaDenmarkDominicaDominican RepublicEastern AfricaEastern AsiaEastern EuropeEcuadorEgyptEl SalvadorEnglandEritreaEthiopiaEuropeFijiFranceGermanyGhanaGreeceGrenadaGuatemalaGuyanaHaitiHondurasHong KongHungaryIndiaIndonesiaIranIraqIrelandIsraelItalyJamaicaJapanJordanKazakhstanKenyaKoreaKuwaitLaosLatin AmericaLatviaLebanonLiberiaLithuaniaMalaysiaMexicoMicronesiaMiddle AfricaMoldovaMoroccoNepalNetherlandsNicaraguaNigeriaNorth AmericaNorth MacedoniaNorthern EuropeNorwayOceaniaPakistanPanamaPeruPhilippinesPolandPortugalRomaniaRussiaSaudi ArabiaScotlandSenegalSerbiaSierra LeoneSingaporeSomaliaSouth AfricaSouth AmericaSouth Central AsiaSouth Eastern AsiaSouthern EuropeSpainSri LankaSt. Vincent and the GrenadinesSudanSwedenSwitzerlandSyriaTaiwanThailandTrinidad and TobagoTurkeyUgandaUkraineUruguayUzbekistanVenezuelaVietnamWest IndiesWestern AfricaWestern AsiaWestern EuropeYemenZaireZimbabweAzores
Immigrants from Northern Africa
Race
Ancestry
AfghanAfricanAlaska NativeAlaskan AthabascanAlbanianAleutAlsatianAmericanApacheArabArapahoArgentineanArmenianAssyrian/Chaldean/SyriacAustralianAustrianBahamianBangladeshiBarbadianBasqueBelgianBelizeanBermudanBhutaneseBlackfeetBolivianBrazilianBritishBritish West IndianBulgarianBurmeseCajunCambodianCanadianCape VerdeanCarpatho RusynCelticCentral AmericanCentral American IndianCherokeeCheyenneChickasawChileanChineseChippewaChoctawColombianColvilleComancheCosta RicanCreeCreekCroatianCrowCubanCypriotCzechCzechoslovakianDanishDelawareDominicanDutchDutch West IndianEastern EuropeanEcuadorianEgyptianEnglishEstonianEthiopianEuropeanFijianFilipinoFinnishFrenchFrench American IndianFrench CanadianGermanGerman RussianGhanaianGreekGuamanian/ChamorroGuatemalanGuyaneseHaitianHmongHonduranHopiHoumaHungarianIcelanderIndian (Asian)IndonesianInupiatIranianIraqiIrishIroquoisIsraeliItalianJamaicanJapaneseJordanianKenyanKiowaKoreanLaotianLatvianLebaneseLiberianLithuanianLumbeeLuxembourgerMacedonianMalaysianMalteseMarshalleseMenomineeMexican American IndianMongolianMoroccanNative HawaiianNavajoNepaleseNew ZealanderNicaraguanNigerianNorthern EuropeanNorwegianOkinawanOsageOttawaPaiutePakistaniPalestinianPanamanianParaguayanPennsylvania GermanPeruvianPimaPolishPortuguesePotawatomiPuebloPuerto RicanPuget Sound SalishRomanianRussianSalvadoranSamoanScandinavianScotch-IrishScottishSeminoleSenegaleseSerbianShoshoneSierra LeoneanSiouxSlavicSlovakSloveneSomaliSouth AfricanSouth AmericanSouth American IndianSoviet UnionSpaniardSpanishSpanish AmericanSpanish American IndianSri LankanSubsaharan AfricanSudaneseSwedishSwissSyrianTaiwaneseThaiTlingit-HaidaTohono O'OdhamTonganTrinidadian and TobagonianTsimshianTurkishU.S. Virgin IslanderUgandanUkrainianUruguayanUteVenezuelanVietnameseWelshWest IndianYakamaYaquiYugoslavianYumanYup'ikZimbabwean
Immigration
NonimmigrantsImmigrantsAfghanistanAfricaAlbaniaArgentinaArmeniaAsiaAustraliaAustriaBahamasBangladeshBarbadosBelarusBelgiumBelizeBoliviaBosnia and HerzegovinaBrazilBulgariaBurma/MyanmarCabo VerdeCambodiaCameroonCanadaCaribbeanCentral AmericaChileChinaColombiaCongoCosta RicaCroatiaCubaCzechoslovakiaDenmarkDominicaDominican RepublicEastern AfricaEastern AsiaEastern EuropeEcuadorEgyptEl SalvadorEnglandEritreaEthiopiaEuropeFijiFranceGermanyGhanaGreeceGrenadaGuatemalaGuyanaHaitiHondurasHong KongHungaryIndiaIndonesiaIranIraqIrelandIsraelItalyJamaicaJapanJordanKazakhstanKenyaKoreaKuwaitLaosLatin AmericaLatviaLebanonLiberiaLithuaniaMalaysiaMexicoMicronesiaMiddle AfricaMoldovaMoroccoNepalNetherlandsNicaraguaNigeriaNorth AmericaNorth MacedoniaNorthern AfricaNorthern EuropeNorwayOceaniaPakistanPanamaPeruPhilippinesPolandPortugalRomaniaRussiaSaudi ArabiaScotlandSenegalSerbiaSierra LeoneSingaporeSomaliaSouth AfricaSouth AmericaSouth Central AsiaSouth Eastern AsiaSouthern EuropeSpainSri LankaSt. Vincent and the GrenadinesSudanSwedenSwitzerlandSyriaTaiwanThailandTrinidad and TobagoTurkeyUgandaUkraineUruguayUzbekistanVenezuelaVietnamWest IndiesWestern AfricaWestern AsiaWestern EuropeYemenZaireZimbabweAzores
Unemployment Among Ages 16 to 19 years
Income
Poverty
Unemployment
Labor Participation
Family Structure
Vehicle Availability
Education Level
Disability

Unemployment Among Ages 16 to 19 years Comparison

Mexicans

Immigrants from Northern Africa

Tragic
Good
18.5%
UNEMPLOYMENT AMONG AGES 16 TO 19 YEARS
0.9/ 100
METRIC RATING
243rd/ 347
METRIC RANK
17.4%
UNEMPLOYMENT AMONG AGES 16 TO 19 YEARS
69.0/ 100
METRIC RATING
152nd/ 347
METRIC RANK

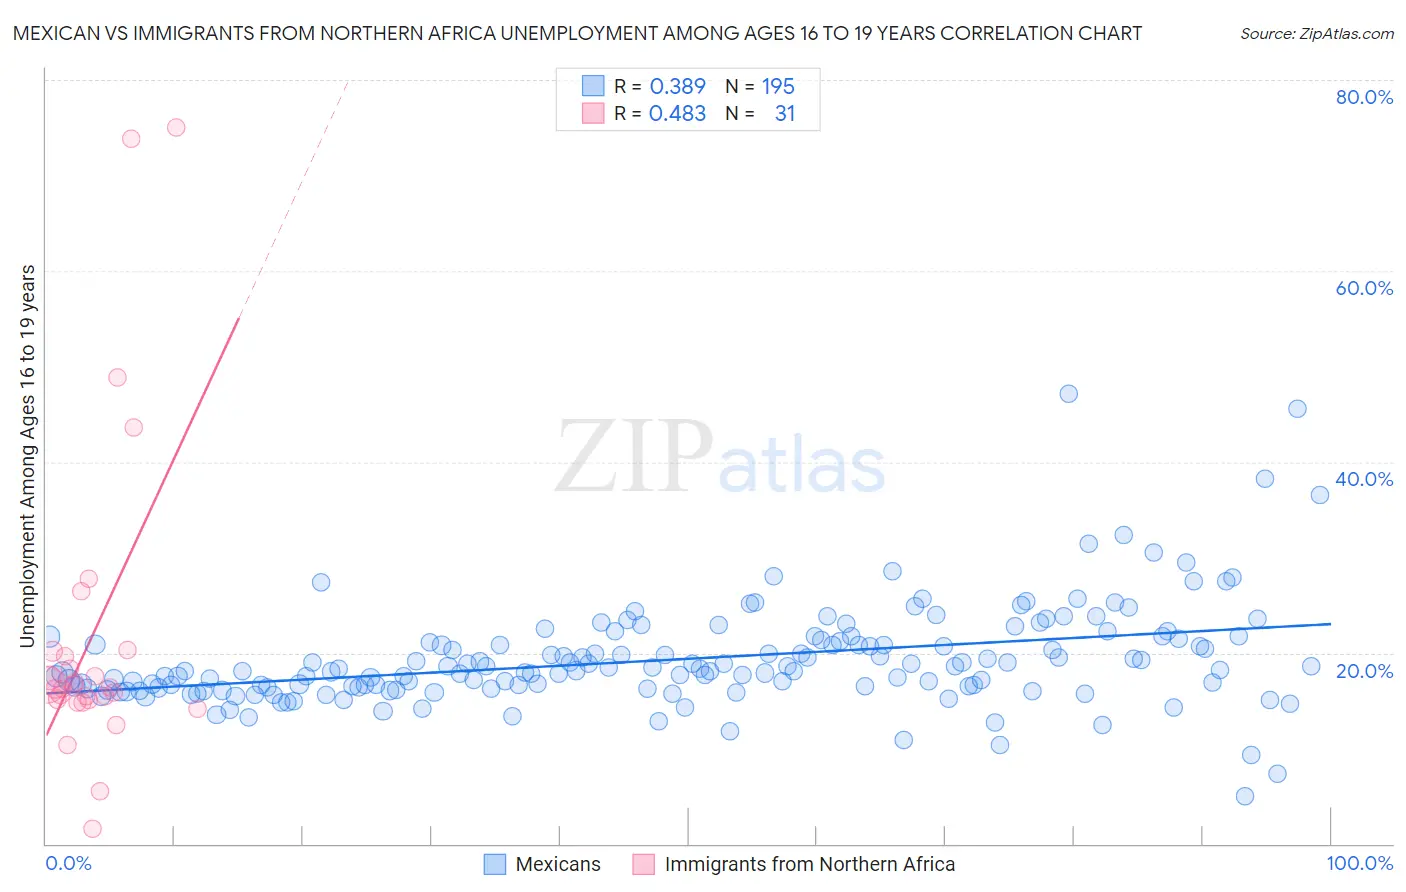
Mexican vs Immigrants from Northern Africa Unemployment Among Ages 16 to 19 years Correlation Chart

The statistical analysis conducted on geographies consisting of 507,406,430 people shows a mild positive correlation between the proportion of Mexicans and unemployment rate among population between the ages 16 and 19 in the United States with a correlation coefficient (R) of 0.389 and weighted average of 18.5%. Similarly, the statistical analysis conducted on geographies consisting of 309,515,333 people shows a moderate positive correlation between the proportion of Immigrants from Northern Africa and unemployment rate among population between the ages 16 and 19 in the United States with a correlation coefficient (R) of 0.483 and weighted average of 17.4%, a difference of 6.5%.
Mexican vs Immigrants from Northern Africa Unemployment Among Ages 16 to 19 years

Unemployment Among Ages 16 to 19 years Correlation Summary

MeasurementMexicanImmigrants from Northern Africa
Minimum5.0%1.5%
Maximum47.1%75.0%
Range42.1%73.5%
Mean19.3%21.8%
Median18.1%16.4%
Interquartile 25% (IQ1)16.3%15.1%
Interquartile 75% (IQ3)21.3%20.2%
Interquartile Range (IQR)4.9%5.1%
Standard Deviation (Sample)5.3%16.7%
Standard Deviation (Population)5.3%16.4%

Similar Demographics by Unemployment Among Ages 16 to 19 years

Demographics Similar to Mexicans by Unemployment Among Ages 16 to 19 years

In terms of unemployment among ages 16 to 19 years, the demographic groups most similar to Mexicans are Moroccan (18.5%, a difference of 0.15%), Guatemalan (18.6%, a difference of 0.21%), Immigrants from Belarus (18.6%, a difference of 0.22%), Immigrants from Ukraine (18.5%, a difference of 0.34%), and Immigrants from South America (18.7%, a difference of 0.65%).
DemographicsRating | RankUnemployment Among Ages 16 to 19 years
Immigrants | Colombia
2.7
/100
|
#236
Tragic
18.3%
Immigrants | Immigrants
2.7
/100
|
#237
Tragic
18.3%
South Americans
2.6
/100
|
#238
Tragic
18.3%
Native Hawaiians
2.4
/100
|
#239
Tragic
18.3%
Immigrants | Cabo Verde
2.0
/100
|
#240
Tragic
18.4%
Immigrants | Ukraine
1.3
/100
|
#241
Tragic
18.5%
Moroccans
1.1
/100
|
#242
Tragic
18.5%
Mexicans
0.9
/100
|
#243
Tragic
18.5%
Guatemalans
0.8
/100
|
#244
Tragic
18.6%
Immigrants | Belarus
0.8
/100
|
#245
Tragic
18.6%
Immigrants | South America
0.5
/100
|
#246
Tragic
18.7%
Immigrants | Israel
0.5
/100
|
#247
Tragic
18.7%
Delaware
0.5
/100
|
#248
Tragic
18.7%
Puget Sound Salish
0.5
/100
|
#249
Tragic
18.7%
Panamanians
0.4
/100
|
#250
Tragic
18.7%

Demographics Similar to Immigrants from Northern Africa by Unemployment Among Ages 16 to 19 years

In terms of unemployment among ages 16 to 19 years, the demographic groups most similar to Immigrants from Northern Africa are Immigrants from Hong Kong (17.4%, a difference of 0.020%), Immigrants from Afghanistan (17.4%, a difference of 0.020%), Afghan (17.4%, a difference of 0.050%), Portuguese (17.4%, a difference of 0.090%), and Costa Rican (17.4%, a difference of 0.16%).
DemographicsRating | RankUnemployment Among Ages 16 to 19 years
Indians (Asian)
77.6
/100
|
#145
Good
17.3%
Turks
77.1
/100
|
#146
Good
17.3%
Tsimshian
76.0
/100
|
#147
Good
17.3%
Romanians
74.9
/100
|
#148
Good
17.3%
Immigrants | Eastern Asia
73.8
/100
|
#149
Good
17.4%
Immigrants | Northern Europe
72.5
/100
|
#150
Good
17.4%
Immigrants | Hong Kong
69.3
/100
|
#151
Good
17.4%
Immigrants | Northern Africa
69.0
/100
|
#152
Good
17.4%
Immigrants | Afghanistan
68.6
/100
|
#153
Good
17.4%
Afghans
68.1
/100
|
#154
Good
17.4%
Portuguese
67.3
/100
|
#155
Good
17.4%
Costa Ricans
65.9
/100
|
#156
Good
17.4%
Uruguayans
64.3
/100
|
#157
Good
17.5%
Immigrants | China
64.1
/100
|
#158
Good
17.5%
Koreans
61.0
/100
|
#159
Good
17.5%