Mexican American Indian vs Thai Unemployment Among Women with Children Under 6 years
COMPARE
Mexican American Indian
Thai
Unemployment Among Women with Children Under 6 years
Unemployment Among Women with Children Under 6 years Comparison
Mexican American Indians
Thais
8.5%
UNEMPLOYMENT AMONG WOMEN WITH CHILDREN UNDER 6 YEARS
0.1/ 100
METRIC RATING
272nd/ 347
METRIC RANK
6.3%
UNEMPLOYMENT AMONG WOMEN WITH CHILDREN UNDER 6 YEARS
100.0/ 100
METRIC RATING
15th/ 347
METRIC RANK
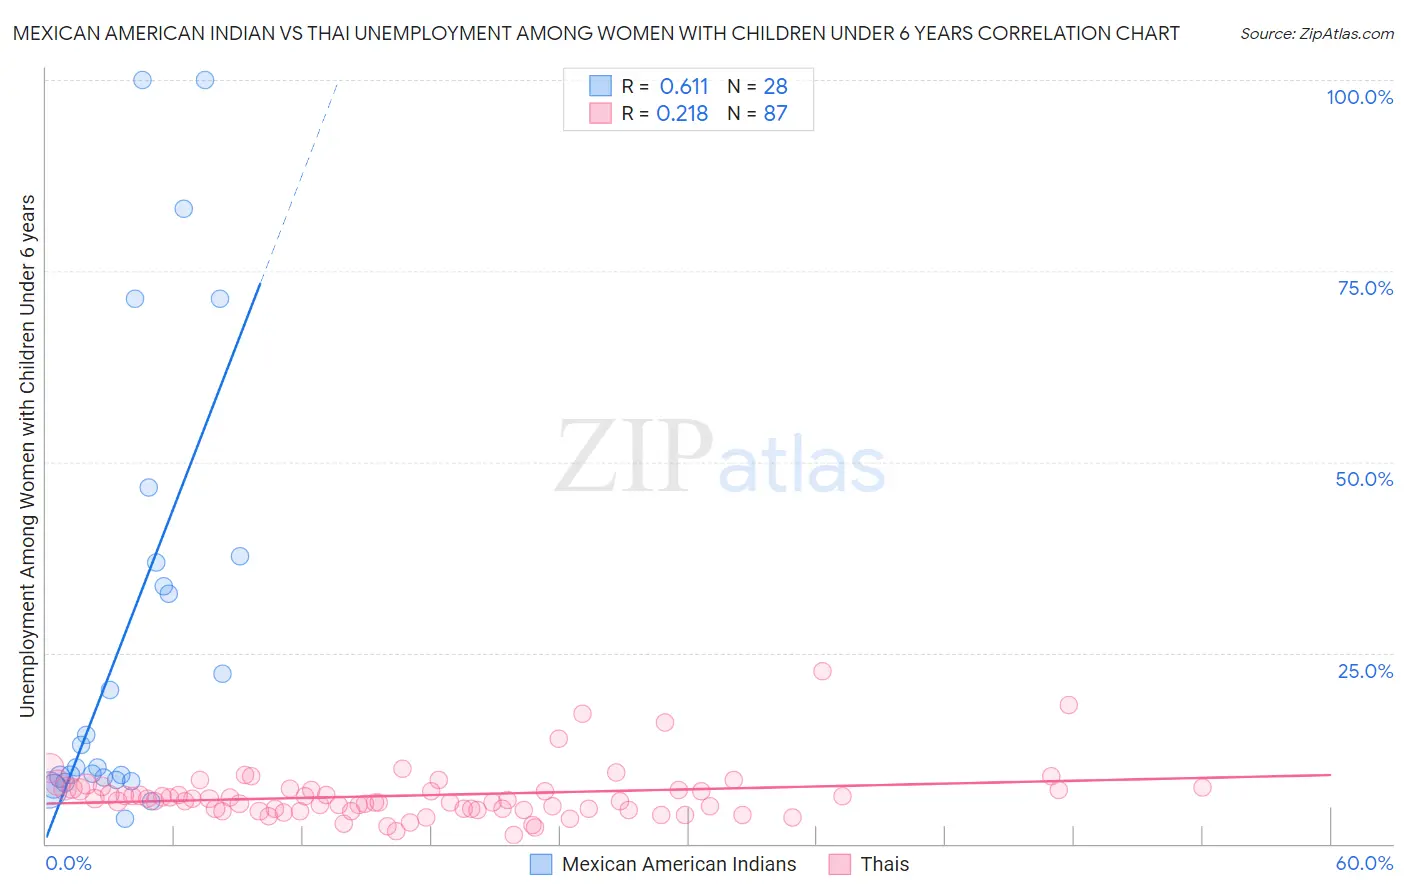
Mexican American Indian vs Thai Unemployment Among Women with Children Under 6 years Correlation Chart
The statistical analysis conducted on geographies consisting of 260,154,891 people shows a significant positive correlation between the proportion of Mexican American Indians and unemployment rate among women with children under the age of 6 in the United States with a correlation coefficient (R) of 0.611 and weighted average of 8.5%. Similarly, the statistical analysis conducted on geographies consisting of 347,481,470 people shows a weak positive correlation between the proportion of Thais and unemployment rate among women with children under the age of 6 in the United States with a correlation coefficient (R) of 0.218 and weighted average of 6.3%, a difference of 34.5%.
Unemployment Among Women with Children Under 6 years Correlation Summary
| Measurement | Mexican American Indian | Thai |
| Minimum | 3.3% | 1.1% |
| Maximum | 100.0% | 22.6% |
| Range | 96.7% | 21.5% |
| Mean | 28.4% | 6.3% |
| Median | 11.4% | 5.8% |
| Interquartile 25% (IQ1) | 8.5% | 4.5% |
| Interquartile 75% (IQ3) | 37.3% | 7.1% |
| Interquartile Range (IQR) | 28.8% | 2.7% |
| Standard Deviation (Sample) | 29.7% | 3.4% |
| Standard Deviation (Population) | 29.2% | 3.4% |
Similar Demographics by Unemployment Among Women with Children Under 6 years
Demographics Similar to Mexican American Indians by Unemployment Among Women with Children Under 6 years
In terms of unemployment among women with children under 6 years, the demographic groups most similar to Mexican American Indians are Slovak (8.5%, a difference of 0.080%), Immigrants from Congo (8.5%, a difference of 0.56%), Immigrants from Senegal (8.5%, a difference of 0.57%), Immigrants from Cameroon (8.6%, a difference of 0.75%), and Immigrants from Latin America (8.6%, a difference of 0.80%).
| Demographics | Rating | Rank | Unemployment Among Women with Children Under 6 years |
| French Canadians | 0.3 /100 | #265 | Tragic 8.4% |
| Immigrants | Honduras | 0.3 /100 | #266 | Tragic 8.4% |
| Belizeans | 0.2 /100 | #267 | Tragic 8.4% |
| Sub-Saharan Africans | 0.2 /100 | #268 | Tragic 8.4% |
| Immigrants | Haiti | 0.2 /100 | #269 | Tragic 8.4% |
| Immigrants | Senegal | 0.2 /100 | #270 | Tragic 8.5% |
| Immigrants | Congo | 0.2 /100 | #271 | Tragic 8.5% |
| Mexican American Indians | 0.1 /100 | #272 | Tragic 8.5% |
| Slovaks | 0.1 /100 | #273 | Tragic 8.5% |
| Immigrants | Cameroon | 0.1 /100 | #274 | Tragic 8.6% |
| Immigrants | Latin America | 0.1 /100 | #275 | Tragic 8.6% |
| Yaqui | 0.0 /100 | #276 | Tragic 8.6% |
| Haitians | 0.0 /100 | #277 | Tragic 8.6% |
| Immigrants | Dominica | 0.0 /100 | #278 | Tragic 8.6% |
| Immigrants | Guatemala | 0.0 /100 | #279 | Tragic 8.6% |
Demographics Similar to Thais by Unemployment Among Women with Children Under 6 years
In terms of unemployment among women with children under 6 years, the demographic groups most similar to Thais are Immigrants from Bulgaria (6.3%, a difference of 0.10%), Immigrants from Uzbekistan (6.3%, a difference of 0.30%), Immigrants from Eastern Asia (6.3%, a difference of 0.42%), Immigrants from Singapore (6.3%, a difference of 0.48%), and Indian (Asian) (6.3%, a difference of 0.49%).
| Demographics | Rating | Rank | Unemployment Among Women with Children Under 6 years |
| Immigrants | India | 100.0 /100 | #8 | Exceptional 6.1% |
| Filipinos | 100.0 /100 | #9 | Exceptional 6.1% |
| Immigrants | China | 100.0 /100 | #10 | Exceptional 6.2% |
| Indians (Asian) | 100.0 /100 | #11 | Exceptional 6.3% |
| Immigrants | Singapore | 100.0 /100 | #12 | Exceptional 6.3% |
| Immigrants | Eastern Asia | 100.0 /100 | #13 | Exceptional 6.3% |
| Immigrants | Bulgaria | 100.0 /100 | #14 | Exceptional 6.3% |
| Thais | 100.0 /100 | #15 | Exceptional 6.3% |
| Immigrants | Uzbekistan | 100.0 /100 | #16 | Exceptional 6.3% |
| Immigrants | Malaysia | 100.0 /100 | #17 | Exceptional 6.4% |
| Assyrians/Chaldeans/Syriacs | 100.0 /100 | #18 | Exceptional 6.5% |
| Mongolians | 100.0 /100 | #19 | Exceptional 6.5% |
| Ute | 100.0 /100 | #20 | Exceptional 6.5% |
| Burmese | 100.0 /100 | #21 | Exceptional 6.5% |
| Immigrants | Korea | 100.0 /100 | #22 | Exceptional 6.5% |