Mexican American Indian vs Immigrants from Philippines Unemployment Among Ages 25 to 29 years
COMPARE
Mexican American Indian
Immigrants from Philippines
Unemployment Among Ages 25 to 29 years
Unemployment Among Ages 25 to 29 years Comparison
Mexican American Indians
Immigrants from Philippines
7.3%
UNEMPLOYMENT AMONG AGES 25 TO 29 YEARS
0.3/ 100
METRIC RATING
256th/ 347
METRIC RANK
6.8%
UNEMPLOYMENT AMONG AGES 25 TO 29 YEARS
16.7/ 100
METRIC RATING
211th/ 347
METRIC RANK
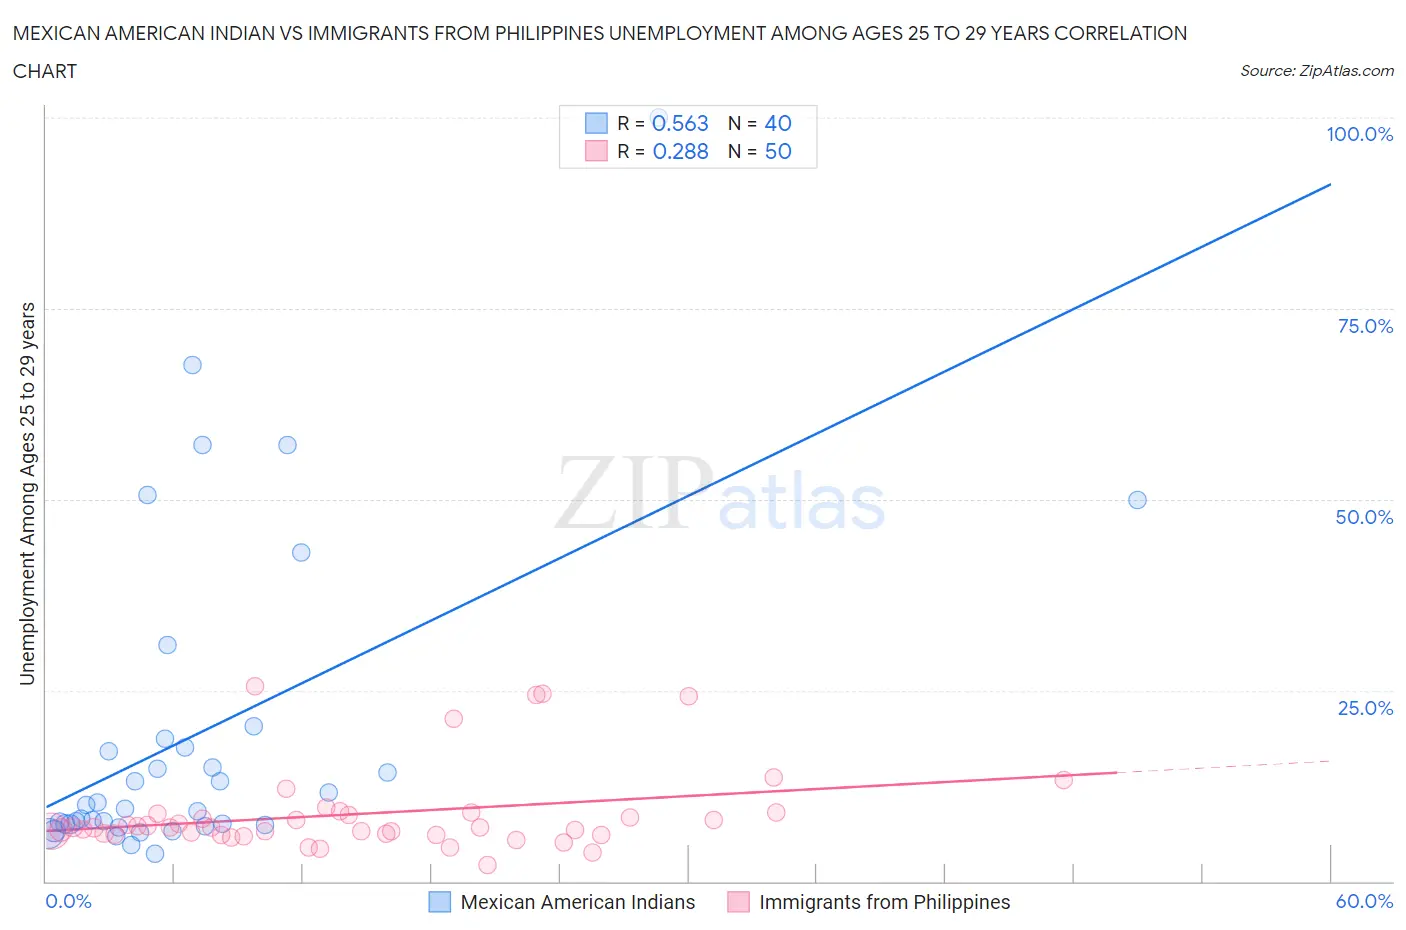
Mexican American Indian vs Immigrants from Philippines Unemployment Among Ages 25 to 29 years Correlation Chart
The statistical analysis conducted on geographies consisting of 308,255,132 people shows a substantial positive correlation between the proportion of Mexican American Indians and unemployment rate among population between the ages 25 and 29 in the United States with a correlation coefficient (R) of 0.563 and weighted average of 7.3%. Similarly, the statistical analysis conducted on geographies consisting of 442,687,196 people shows a weak positive correlation between the proportion of Immigrants from Philippines and unemployment rate among population between the ages 25 and 29 in the United States with a correlation coefficient (R) of 0.288 and weighted average of 6.8%, a difference of 6.6%.
Unemployment Among Ages 25 to 29 years Correlation Summary
| Measurement | Mexican American Indian | Immigrants from Philippines |
| Minimum | 3.6% | 2.1% |
| Maximum | 100.0% | 25.6% |
| Range | 96.4% | 23.5% |
| Mean | 19.4% | 8.8% |
| Median | 9.7% | 7.0% |
| Interquartile 25% (IQ1) | 7.4% | 6.2% |
| Interquartile 75% (IQ3) | 18.1% | 8.9% |
| Interquartile Range (IQR) | 10.6% | 2.7% |
| Standard Deviation (Sample) | 21.3% | 5.5% |
| Standard Deviation (Population) | 21.0% | 5.5% |
Similar Demographics by Unemployment Among Ages 25 to 29 years
Demographics Similar to Mexican American Indians by Unemployment Among Ages 25 to 29 years
In terms of unemployment among ages 25 to 29 years, the demographic groups most similar to Mexican American Indians are Immigrants from Cameroon (7.2%, a difference of 0.20%), Ghanaian (7.2%, a difference of 0.26%), Assyrian/Chaldean/Syriac (7.3%, a difference of 0.37%), Immigrants from Portugal (7.2%, a difference of 0.40%), and Sierra Leonean (7.2%, a difference of 0.73%).
| Demographics | Rating | Rank | Unemployment Among Ages 25 to 29 years |
| Seminole | 0.6 /100 | #249 | Tragic 7.2% |
| Delaware | 0.5 /100 | #250 | Tragic 7.2% |
| Portuguese | 0.5 /100 | #251 | Tragic 7.2% |
| Sierra Leoneans | 0.4 /100 | #252 | Tragic 7.2% |
| Immigrants | Portugal | 0.3 /100 | #253 | Tragic 7.2% |
| Ghanaians | 0.3 /100 | #254 | Tragic 7.2% |
| Immigrants | Cameroon | 0.3 /100 | #255 | Tragic 7.2% |
| Mexican American Indians | 0.3 /100 | #256 | Tragic 7.3% |
| Assyrians/Chaldeans/Syriacs | 0.2 /100 | #257 | Tragic 7.3% |
| Ottawa | 0.1 /100 | #258 | Tragic 7.3% |
| Cree | 0.1 /100 | #259 | Tragic 7.3% |
| Americans | 0.1 /100 | #260 | Tragic 7.4% |
| Nigerians | 0.1 /100 | #261 | Tragic 7.4% |
| Ecuadorians | 0.1 /100 | #262 | Tragic 7.4% |
| Kiowa | 0.1 /100 | #263 | Tragic 7.4% |
Demographics Similar to Immigrants from Philippines by Unemployment Among Ages 25 to 29 years
In terms of unemployment among ages 25 to 29 years, the demographic groups most similar to Immigrants from Philippines are Canadian (6.8%, a difference of 0.030%), Hawaiian (6.8%, a difference of 0.050%), Immigrants from Cabo Verde (6.8%, a difference of 0.050%), Immigrants from Syria (6.8%, a difference of 0.17%), and Immigrants from Germany (6.8%, a difference of 0.23%).
| Demographics | Rating | Rank | Unemployment Among Ages 25 to 29 years |
| Scotch-Irish | 20.0 /100 | #204 | Poor 6.8% |
| Immigrants | England | 19.8 /100 | #205 | Poor 6.8% |
| Ugandans | 19.8 /100 | #206 | Poor 6.8% |
| Immigrants | Denmark | 19.0 /100 | #207 | Poor 6.8% |
| Immigrants | Germany | 18.8 /100 | #208 | Poor 6.8% |
| Hawaiians | 17.1 /100 | #209 | Poor 6.8% |
| Canadians | 16.9 /100 | #210 | Poor 6.8% |
| Immigrants | Philippines | 16.7 /100 | #211 | Poor 6.8% |
| Immigrants | Cabo Verde | 16.2 /100 | #212 | Poor 6.8% |
| Immigrants | Syria | 15.1 /100 | #213 | Poor 6.8% |
| Liberians | 14.7 /100 | #214 | Poor 6.8% |
| Spanish | 14.4 /100 | #215 | Poor 6.8% |
| Slovaks | 14.3 /100 | #216 | Poor 6.8% |
| Ute | 13.4 /100 | #217 | Poor 6.8% |
| Immigrants | Austria | 12.3 /100 | #218 | Poor 6.8% |