Mexican American Indian vs Immigrants from Pakistan Unemployment Among Ages 45 to 54 years
COMPARE
Mexican American Indian
Immigrants from Pakistan
Unemployment Among Ages 45 to 54 years
Unemployment Among Ages 45 to 54 years Comparison
Mexican American Indians
Immigrants from Pakistan
4.9%
UNEMPLOYMENT AMONG AGES 45 TO 54 YEARS
0.1/ 100
METRIC RATING
260th/ 347
METRIC RANK
4.3%
UNEMPLOYMENT AMONG AGES 45 TO 54 YEARS
99.2/ 100
METRIC RATING
61st/ 347
METRIC RANK
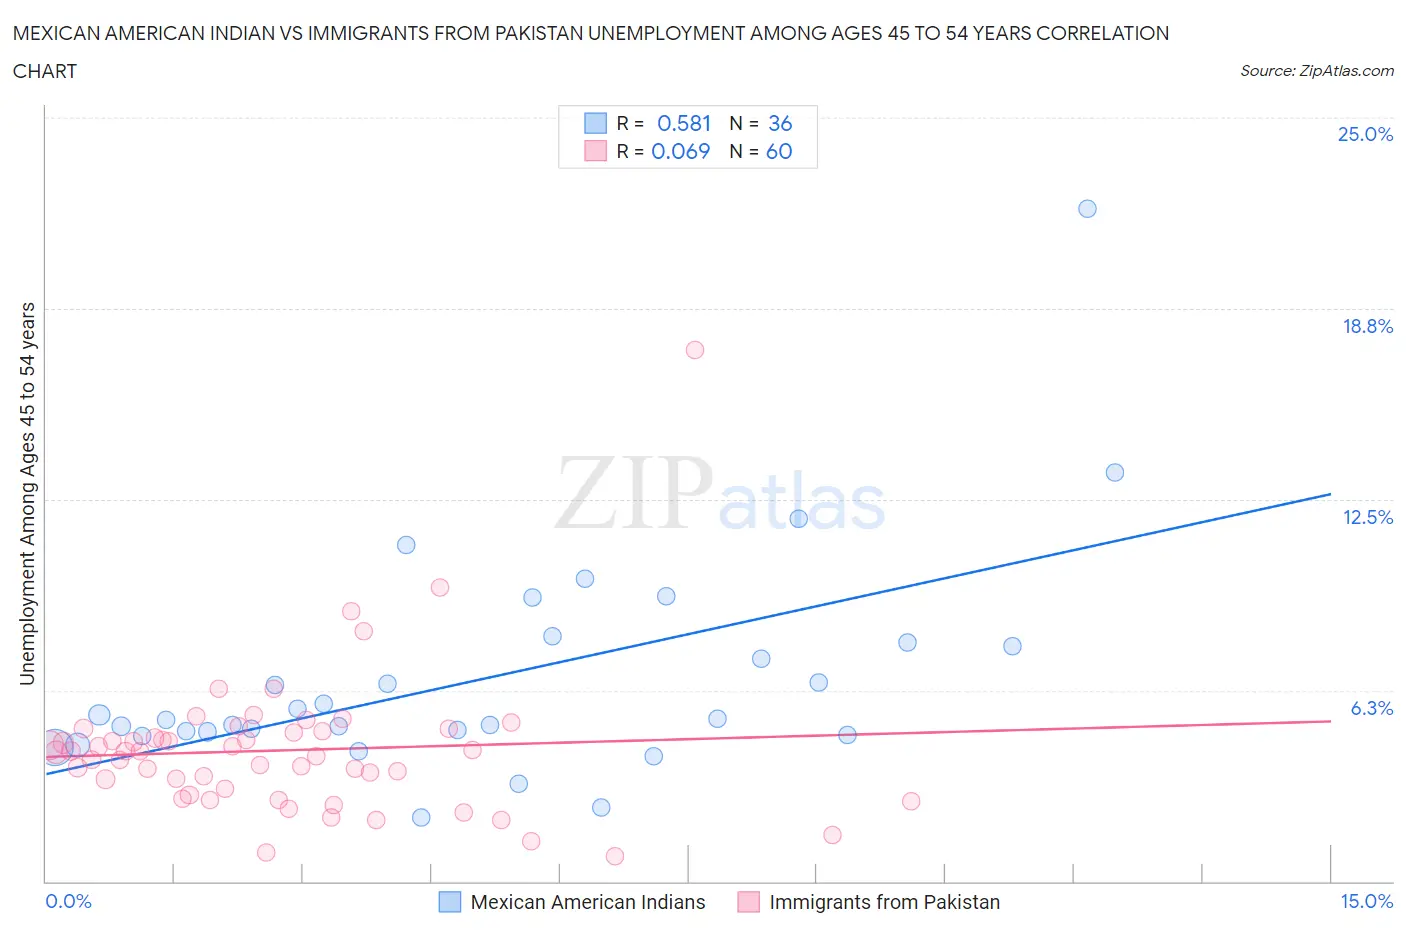
Mexican American Indian vs Immigrants from Pakistan Unemployment Among Ages 45 to 54 years Correlation Chart
The statistical analysis conducted on geographies consisting of 312,262,767 people shows a substantial positive correlation between the proportion of Mexican American Indians and unemployment rate among population between the ages 45 and 54 in the United States with a correlation coefficient (R) of 0.581 and weighted average of 4.9%. Similarly, the statistical analysis conducted on geographies consisting of 280,232,372 people shows a slight positive correlation between the proportion of Immigrants from Pakistan and unemployment rate among population between the ages 45 and 54 in the United States with a correlation coefficient (R) of 0.069 and weighted average of 4.3%, a difference of 14.1%.
Unemployment Among Ages 45 to 54 years Correlation Summary
| Measurement | Mexican American Indian | Immigrants from Pakistan |
| Minimum | 2.1% | 0.80% |
| Maximum | 22.0% | 17.4% |
| Range | 19.9% | 16.6% |
| Mean | 6.6% | 4.3% |
| Median | 5.3% | 4.2% |
| Interquartile 25% (IQ1) | 4.8% | 2.9% |
| Interquartile 75% (IQ3) | 7.7% | 4.9% |
| Interquartile Range (IQR) | 2.9% | 2.0% |
| Standard Deviation (Sample) | 3.6% | 2.4% |
| Standard Deviation (Population) | 3.6% | 2.4% |
Similar Demographics by Unemployment Among Ages 45 to 54 years
Demographics Similar to Mexican American Indians by Unemployment Among Ages 45 to 54 years
In terms of unemployment among ages 45 to 54 years, the demographic groups most similar to Mexican American Indians are Guatemalan (4.9%, a difference of 0.0%), Ugandan (4.9%, a difference of 0.010%), Subsaharan African (4.9%, a difference of 0.16%), Immigrants from Western Africa (4.9%, a difference of 0.20%), and Mexican (4.9%, a difference of 0.24%).
| Demographics | Rating | Rank | Unemployment Among Ages 45 to 54 years |
| Moroccans | 0.3 /100 | #253 | Tragic 4.8% |
| Immigrants | Lebanon | 0.2 /100 | #254 | Tragic 4.8% |
| Immigrants | El Salvador | 0.2 /100 | #255 | Tragic 4.8% |
| Immigrants | Western Asia | 0.2 /100 | #256 | Tragic 4.8% |
| Immigrants | Western Africa | 0.2 /100 | #257 | Tragic 4.9% |
| Sub-Saharan Africans | 0.2 /100 | #258 | Tragic 4.9% |
| Ugandans | 0.1 /100 | #259 | Tragic 4.9% |
| Mexican American Indians | 0.1 /100 | #260 | Tragic 4.9% |
| Guatemalans | 0.1 /100 | #261 | Tragic 4.9% |
| Mexicans | 0.1 /100 | #262 | Tragic 4.9% |
| Immigrants | Fiji | 0.1 /100 | #263 | Tragic 4.9% |
| Immigrants | Guatemala | 0.1 /100 | #264 | Tragic 4.9% |
| Immigrants | Somalia | 0.1 /100 | #265 | Tragic 4.9% |
| Ghanaians | 0.0 /100 | #266 | Tragic 4.9% |
| Bahamians | 0.0 /100 | #267 | Tragic 4.9% |
Demographics Similar to Immigrants from Pakistan by Unemployment Among Ages 45 to 54 years
In terms of unemployment among ages 45 to 54 years, the demographic groups most similar to Immigrants from Pakistan are Immigrants from Korea (4.3%, a difference of 0.0%), Okinawan (4.3%, a difference of 0.040%), Greek (4.3%, a difference of 0.11%), Lithuanian (4.3%, a difference of 0.14%), and Immigrants from Sri Lanka (4.3%, a difference of 0.16%).
| Demographics | Rating | Rank | Unemployment Among Ages 45 to 54 years |
| Chickasaw | 99.5 /100 | #54 | Exceptional 4.2% |
| Latvians | 99.4 /100 | #55 | Exceptional 4.2% |
| Immigrants | Jordan | 99.3 /100 | #56 | Exceptional 4.3% |
| Immigrants | Sri Lanka | 99.3 /100 | #57 | Exceptional 4.3% |
| Greeks | 99.3 /100 | #58 | Exceptional 4.3% |
| Okinawans | 99.2 /100 | #59 | Exceptional 4.3% |
| Immigrants | Korea | 99.2 /100 | #60 | Exceptional 4.3% |
| Immigrants | Pakistan | 99.2 /100 | #61 | Exceptional 4.3% |
| Lithuanians | 99.1 /100 | #62 | Exceptional 4.3% |
| Pennsylvania Germans | 99.1 /100 | #63 | Exceptional 4.3% |
| Austrians | 99.0 /100 | #64 | Exceptional 4.3% |
| Immigrants | Sudan | 99.0 /100 | #65 | Exceptional 4.3% |
| Turks | 98.9 /100 | #66 | Exceptional 4.3% |
| Immigrants | Nepal | 98.9 /100 | #67 | Exceptional 4.3% |
| Slovaks | 98.8 /100 | #68 | Exceptional 4.3% |