Mexican American Indian vs Immigrants from Dominica Unemployment Among Youth under 25 years
COMPARE
Mexican American Indian
Immigrants from Dominica
Unemployment Among Youth under 25 years
Unemployment Among Youth under 25 years Comparison
Mexican American Indians
Immigrants from Dominica
12.3%
UNEMPLOYMENT AMONG YOUTH UNDER 25 YEARS
0.4/ 100
METRIC RATING
251st/ 347
METRIC RANK
14.6%
UNEMPLOYMENT AMONG YOUTH UNDER 25 YEARS
0.0/ 100
METRIC RATING
318th/ 347
METRIC RANK
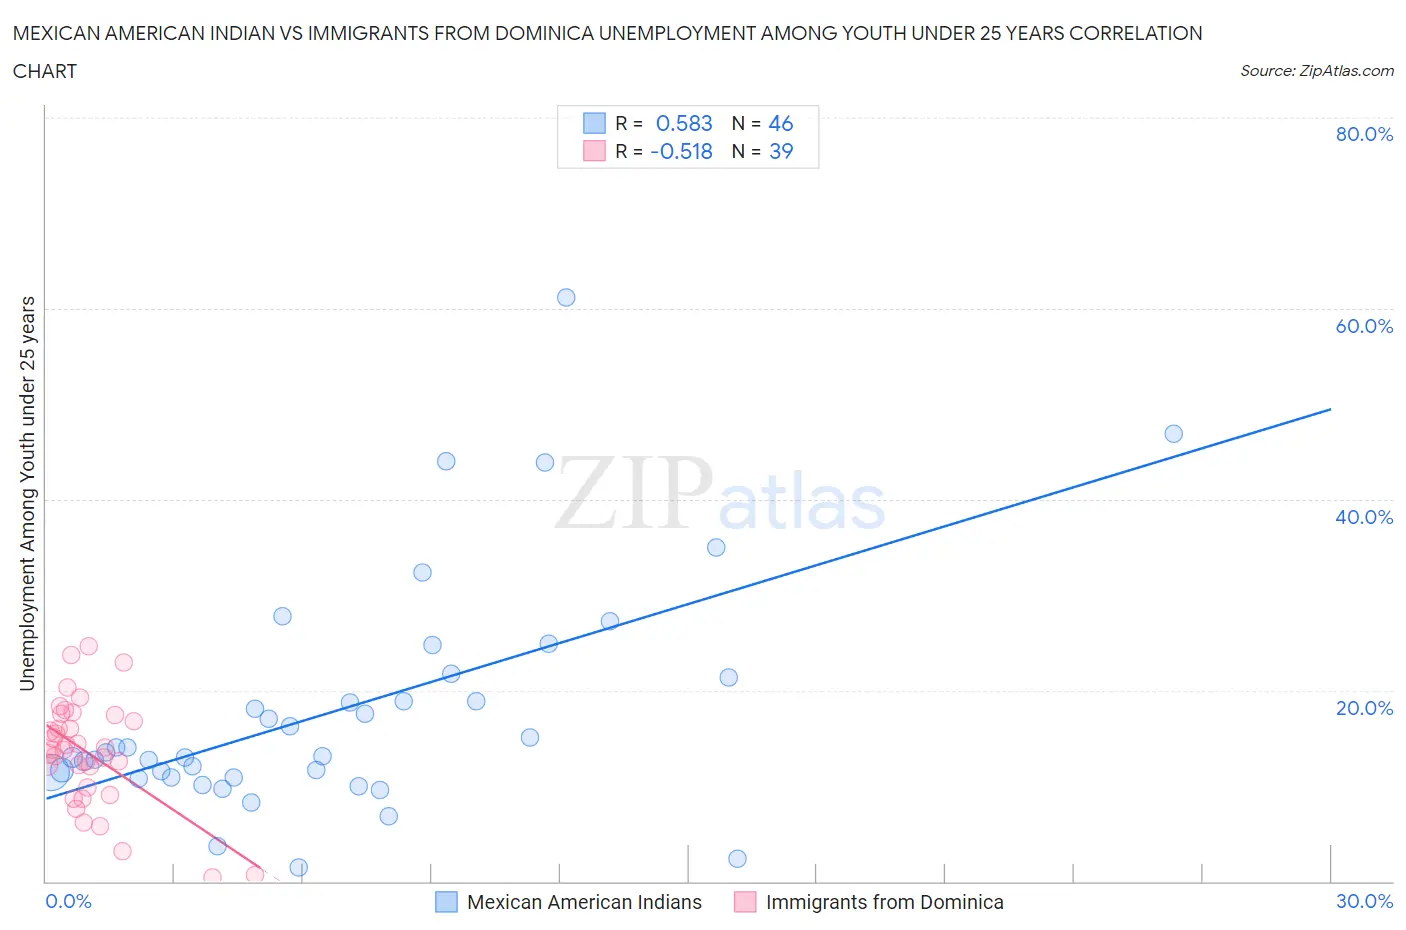
Mexican American Indian vs Immigrants from Dominica Unemployment Among Youth under 25 years Correlation Chart
The statistical analysis conducted on geographies consisting of 315,368,909 people shows a substantial positive correlation between the proportion of Mexican American Indians and unemployment rate among youth under the age of 25 in the United States with a correlation coefficient (R) of 0.583 and weighted average of 12.3%. Similarly, the statistical analysis conducted on geographies consisting of 83,611,163 people shows a substantial negative correlation between the proportion of Immigrants from Dominica and unemployment rate among youth under the age of 25 in the United States with a correlation coefficient (R) of -0.518 and weighted average of 14.6%, a difference of 18.7%.
Unemployment Among Youth under 25 years Correlation Summary
| Measurement | Mexican American Indian | Immigrants from Dominica |
| Minimum | 1.5% | 0.40% |
| Maximum | 61.2% | 24.6% |
| Range | 59.7% | 24.2% |
| Mean | 17.9% | 13.5% |
| Median | 13.3% | 13.8% |
| Interquartile 25% (IQ1) | 10.9% | 9.8% |
| Interquartile 75% (IQ3) | 21.3% | 17.4% |
| Interquartile Range (IQR) | 10.4% | 7.7% |
| Standard Deviation (Sample) | 12.1% | 5.6% |
| Standard Deviation (Population) | 12.0% | 5.6% |
Similar Demographics by Unemployment Among Youth under 25 years
Demographics Similar to Mexican American Indians by Unemployment Among Youth under 25 years
In terms of unemployment among youth under 25 years, the demographic groups most similar to Mexican American Indians are Delaware (12.3%, a difference of 0.030%), Immigrants from Syria (12.3%, a difference of 0.040%), Mexican (12.3%, a difference of 0.080%), Honduran (12.3%, a difference of 0.10%), and Soviet Union (12.2%, a difference of 0.45%).
| Demographics | Rating | Rank | Unemployment Among Youth under 25 years |
| Alaskan Athabascans | 0.6 /100 | #244 | Tragic 12.2% |
| Spanish Americans | 0.6 /100 | #245 | Tragic 12.2% |
| Immigrants | Honduras | 0.6 /100 | #246 | Tragic 12.2% |
| Immigrants | Greece | 0.6 /100 | #247 | Tragic 12.2% |
| Central Americans | 0.6 /100 | #248 | Tragic 12.2% |
| Soviet Union | 0.6 /100 | #249 | Tragic 12.2% |
| Delaware | 0.4 /100 | #250 | Tragic 12.3% |
| Mexican American Indians | 0.4 /100 | #251 | Tragic 12.3% |
| Immigrants | Syria | 0.3 /100 | #252 | Tragic 12.3% |
| Mexicans | 0.3 /100 | #253 | Tragic 12.3% |
| Hondurans | 0.3 /100 | #254 | Tragic 12.3% |
| Hispanics or Latinos | 0.2 /100 | #255 | Tragic 12.4% |
| Liberians | 0.2 /100 | #256 | Tragic 12.4% |
| Panamanians | 0.2 /100 | #257 | Tragic 12.4% |
| Salvadorans | 0.1 /100 | #258 | Tragic 12.4% |
Demographics Similar to Immigrants from Dominica by Unemployment Among Youth under 25 years
In terms of unemployment among youth under 25 years, the demographic groups most similar to Immigrants from Dominica are West Indian (14.6%, a difference of 0.040%), Barbadian (14.6%, a difference of 0.080%), Cheyenne (14.6%, a difference of 0.24%), Trinidadian and Tobagonian (14.6%, a difference of 0.31%), and Immigrants from Trinidad and Tobago (14.6%, a difference of 0.40%).
| Demographics | Rating | Rank | Unemployment Among Youth under 25 years |
| Immigrants | Bangladesh | 0.0 /100 | #311 | Tragic 14.2% |
| Vietnamese | 0.0 /100 | #312 | Tragic 14.3% |
| Immigrants | Armenia | 0.0 /100 | #313 | Tragic 14.4% |
| Jamaicans | 0.0 /100 | #314 | Tragic 14.4% |
| Sioux | 0.0 /100 | #315 | Tragic 14.4% |
| Natives/Alaskans | 0.0 /100 | #316 | Tragic 14.5% |
| Blacks/African Americans | 0.0 /100 | #317 | Tragic 14.5% |
| Immigrants | Dominica | 0.0 /100 | #318 | Tragic 14.6% |
| West Indians | 0.0 /100 | #319 | Tragic 14.6% |
| Barbadians | 0.0 /100 | #320 | Tragic 14.6% |
| Cheyenne | 0.0 /100 | #321 | Tragic 14.6% |
| Trinidadians and Tobagonians | 0.0 /100 | #322 | Tragic 14.6% |
| Immigrants | Trinidad and Tobago | 0.0 /100 | #323 | Tragic 14.6% |
| Immigrants | Jamaica | 0.0 /100 | #324 | Tragic 14.8% |
| Alaska Natives | 0.0 /100 | #325 | Tragic 14.9% |