Mexican American Indian vs American Unemployment Among Ages 16 to 19 years
COMPARE
Mexican American Indian
American
Unemployment Among Ages 16 to 19 years
Unemployment Among Ages 16 to 19 years Comparison
Mexican American Indians
Americans
18.8%
UNEMPLOYMENT AMONG AGES 16 TO 19 YEARS
0.3/ 100
METRIC RATING
256th/ 347
METRIC RANK
17.6%
UNEMPLOYMENT AMONG AGES 16 TO 19 YEARS
47.4/ 100
METRIC RATING
179th/ 347
METRIC RANK
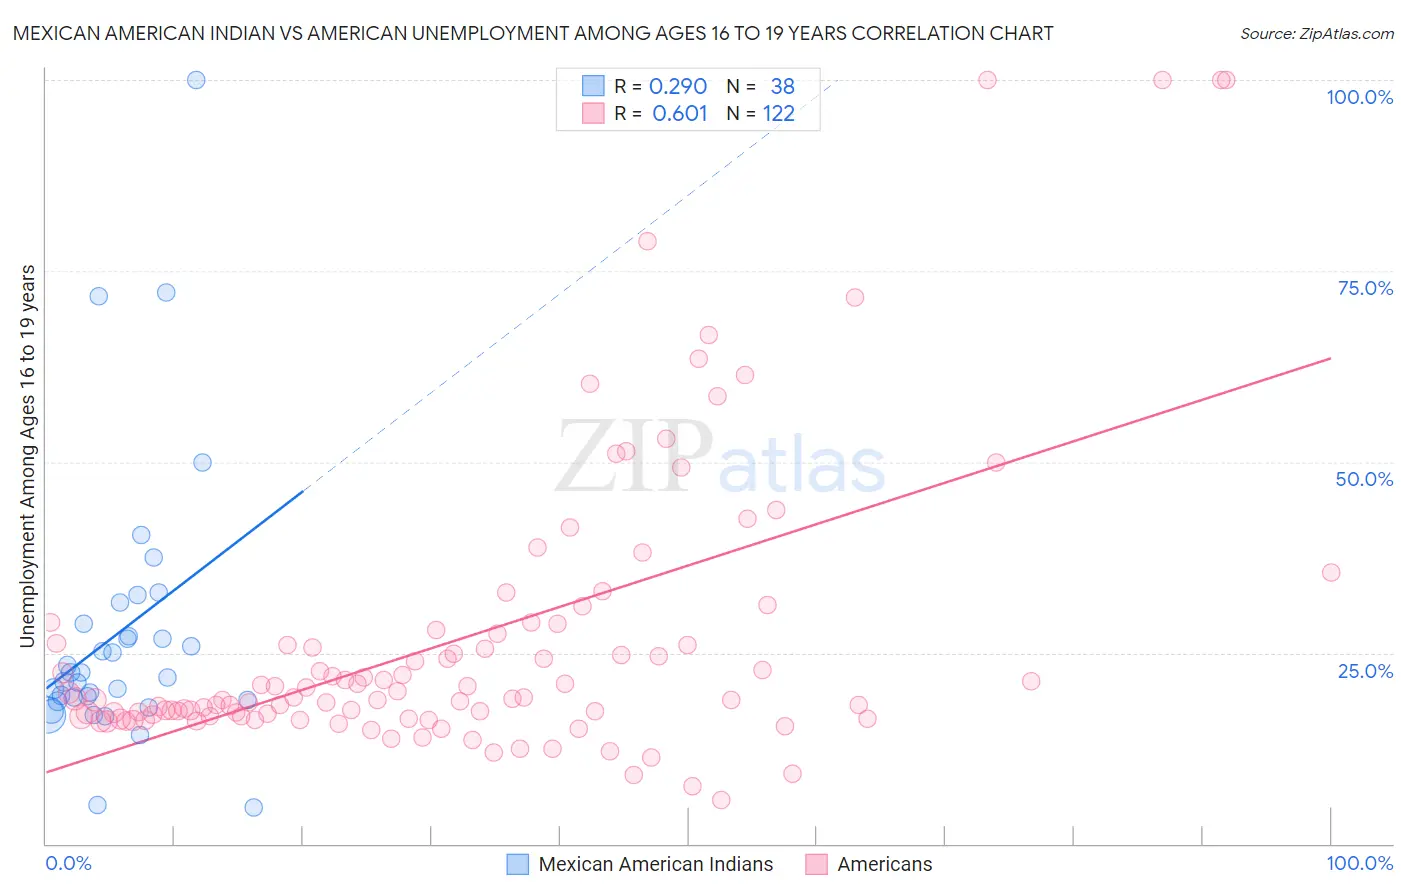
Mexican American Indian vs American Unemployment Among Ages 16 to 19 years Correlation Chart
The statistical analysis conducted on geographies consisting of 306,565,070 people shows a weak positive correlation between the proportion of Mexican American Indians and unemployment rate among population between the ages 16 and 19 in the United States with a correlation coefficient (R) of 0.290 and weighted average of 18.8%. Similarly, the statistical analysis conducted on geographies consisting of 513,985,101 people shows a significant positive correlation between the proportion of Americans and unemployment rate among population between the ages 16 and 19 in the United States with a correlation coefficient (R) of 0.601 and weighted average of 17.6%, a difference of 6.9%.
Unemployment Among Ages 16 to 19 years Correlation Summary
| Measurement | Mexican American Indian | American |
| Minimum | 4.8% | 5.7% |
| Maximum | 100.0% | 100.0% |
| Range | 95.2% | 94.3% |
| Mean | 27.7% | 26.8% |
| Median | 22.0% | 19.1% |
| Interquartile 25% (IQ1) | 18.8% | 16.7% |
| Interquartile 75% (IQ3) | 28.8% | 27.5% |
| Interquartile Range (IQR) | 10.0% | 10.9% |
| Standard Deviation (Sample) | 18.4% | 19.3% |
| Standard Deviation (Population) | 18.1% | 19.2% |
Similar Demographics by Unemployment Among Ages 16 to 19 years
Demographics Similar to Mexican American Indians by Unemployment Among Ages 16 to 19 years
In terms of unemployment among ages 16 to 19 years, the demographic groups most similar to Mexican American Indians are Immigrants from Cameroon (18.8%, a difference of 0.070%), Apache (18.8%, a difference of 0.080%), Central American (18.8%, a difference of 0.11%), Immigrants from Nigeria (18.9%, a difference of 0.26%), and Immigrants from Mexico (18.9%, a difference of 0.40%).
| Demographics | Rating | Rank | Unemployment Among Ages 16 to 19 years |
| Puget Sound Salish | 0.5 /100 | #249 | Tragic 18.7% |
| Panamanians | 0.4 /100 | #250 | Tragic 18.7% |
| Sub-Saharan Africans | 0.4 /100 | #251 | Tragic 18.7% |
| Immigrants | Guatemala | 0.4 /100 | #252 | Tragic 18.7% |
| Central Americans | 0.3 /100 | #253 | Tragic 18.8% |
| Apache | 0.3 /100 | #254 | Tragic 18.8% |
| Immigrants | Cameroon | 0.3 /100 | #255 | Tragic 18.8% |
| Mexican American Indians | 0.3 /100 | #256 | Tragic 18.8% |
| Immigrants | Nigeria | 0.2 /100 | #257 | Tragic 18.9% |
| Immigrants | Mexico | 0.2 /100 | #258 | Tragic 18.9% |
| Immigrants | Central America | 0.2 /100 | #259 | Tragic 18.9% |
| Nigerians | 0.2 /100 | #260 | Tragic 18.9% |
| Spanish American Indians | 0.1 /100 | #261 | Tragic 18.9% |
| Salvadorans | 0.1 /100 | #262 | Tragic 18.9% |
| Cree | 0.1 /100 | #263 | Tragic 19.0% |
Demographics Similar to Americans by Unemployment Among Ages 16 to 19 years
In terms of unemployment among ages 16 to 19 years, the demographic groups most similar to Americans are Spaniard (17.6%, a difference of 0.010%), Bermudan (17.6%, a difference of 0.060%), Celtic (17.6%, a difference of 0.060%), Nicaraguan (17.6%, a difference of 0.070%), and Immigrants from Sweden (17.6%, a difference of 0.080%).
| Demographics | Rating | Rank | Unemployment Among Ages 16 to 19 years |
| Immigrants | Western Europe | 52.2 /100 | #172 | Average 17.6% |
| Chileans | 50.8 /100 | #173 | Average 17.6% |
| Osage | 50.0 /100 | #174 | Average 17.6% |
| Immigrants | Sweden | 49.1 /100 | #175 | Average 17.6% |
| Nicaraguans | 48.9 /100 | #176 | Average 17.6% |
| Bermudans | 48.7 /100 | #177 | Average 17.6% |
| Celtics | 48.7 /100 | #178 | Average 17.6% |
| Americans | 47.4 /100 | #179 | Average 17.6% |
| Spaniards | 47.1 /100 | #180 | Average 17.6% |
| Immigrants | Turkey | 45.6 /100 | #181 | Average 17.6% |
| Russians | 45.2 /100 | #182 | Average 17.6% |
| Immigrants | Uruguay | 44.6 /100 | #183 | Average 17.6% |
| Eastern Europeans | 44.3 /100 | #184 | Average 17.6% |
| Iroquois | 43.4 /100 | #185 | Average 17.6% |
| Japanese | 43.2 /100 | #186 | Average 17.6% |