Marshallese vs Immigrants from Australia Unemployment Among Ages 30 to 34 years
COMPARE
Marshallese
Immigrants from Australia
Unemployment Among Ages 30 to 34 years
Unemployment Among Ages 30 to 34 years Comparison
Marshallese
Immigrants from Australia
7.2%
UNEMPLOYMENT AMONG AGES 30 TO 34 YEARS
0.0/ 100
METRIC RATING
322nd/ 347
METRIC RANK
5.2%
UNEMPLOYMENT AMONG AGES 30 TO 34 YEARS
93.5/ 100
METRIC RATING
86th/ 347
METRIC RANK
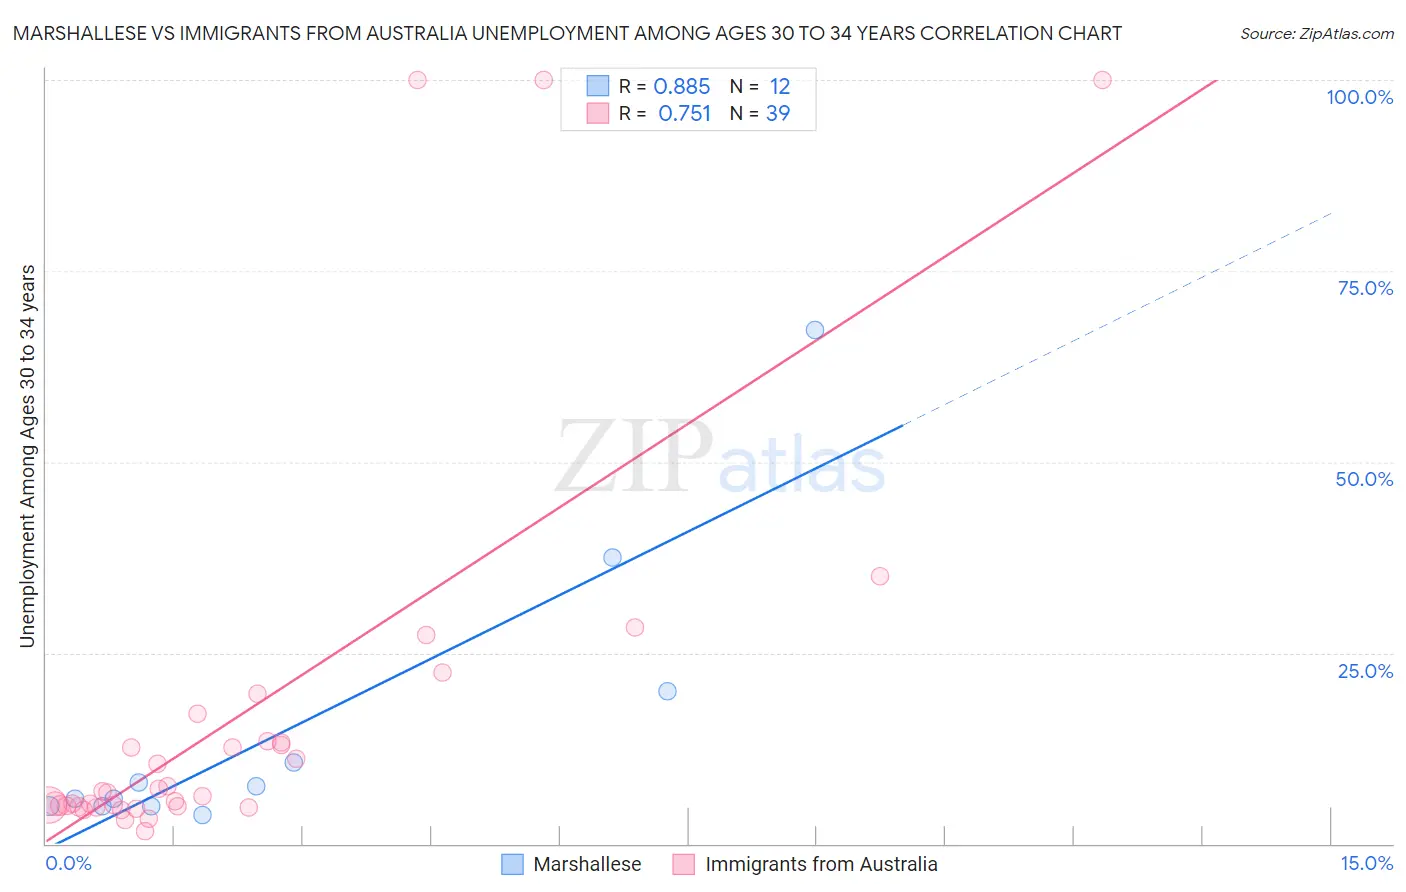
Marshallese vs Immigrants from Australia Unemployment Among Ages 30 to 34 years Correlation Chart
The statistical analysis conducted on geographies consisting of 14,614,488 people shows a very strong positive correlation between the proportion of Marshallese and unemployment rate among population between the ages 30 and 34 in the United States with a correlation coefficient (R) of 0.885 and weighted average of 7.2%. Similarly, the statistical analysis conducted on geographies consisting of 218,832,474 people shows a strong positive correlation between the proportion of Immigrants from Australia and unemployment rate among population between the ages 30 and 34 in the United States with a correlation coefficient (R) of 0.751 and weighted average of 5.2%, a difference of 39.1%.
Unemployment Among Ages 30 to 34 years Correlation Summary
| Measurement | Marshallese | Immigrants from Australia |
| Minimum | 3.8% | 1.7% |
| Maximum | 67.2% | 100.0% |
| Range | 63.4% | 98.3% |
| Mean | 15.1% | 16.7% |
| Median | 6.8% | 6.6% |
| Interquartile 25% (IQ1) | 4.9% | 4.9% |
| Interquartile 75% (IQ3) | 15.3% | 13.4% |
| Interquartile Range (IQR) | 10.4% | 8.5% |
| Standard Deviation (Sample) | 19.0% | 25.5% |
| Standard Deviation (Population) | 18.2% | 25.2% |
Similar Demographics by Unemployment Among Ages 30 to 34 years
Demographics Similar to Marshallese by Unemployment Among Ages 30 to 34 years
In terms of unemployment among ages 30 to 34 years, the demographic groups most similar to Marshallese are Immigrants from Yemen (7.3%, a difference of 0.46%), Immigrants from Guyana (7.2%, a difference of 0.50%), Cape Verdean (7.2%, a difference of 0.79%), Guyanese (7.2%, a difference of 0.81%), and Black/African American (7.2%, a difference of 0.88%).
| Demographics | Rating | Rank | Unemployment Among Ages 30 to 34 years |
| Aleuts | 0.0 /100 | #315 | Tragic 7.1% |
| Houma | 0.0 /100 | #316 | Tragic 7.2% |
| Immigrants | Cabo Verde | 0.0 /100 | #317 | Tragic 7.2% |
| Blacks/African Americans | 0.0 /100 | #318 | Tragic 7.2% |
| Guyanese | 0.0 /100 | #319 | Tragic 7.2% |
| Cape Verdeans | 0.0 /100 | #320 | Tragic 7.2% |
| Immigrants | Guyana | 0.0 /100 | #321 | Tragic 7.2% |
| Marshallese | 0.0 /100 | #322 | Tragic 7.2% |
| Immigrants | Yemen | 0.0 /100 | #323 | Tragic 7.3% |
| Immigrants | Dominica | 0.0 /100 | #324 | Tragic 7.3% |
| Apache | 0.0 /100 | #325 | Tragic 7.3% |
| Dominicans | 0.0 /100 | #326 | Tragic 7.7% |
| Immigrants | Dominican Republic | 0.0 /100 | #327 | Tragic 7.7% |
| Chippewa | 0.0 /100 | #328 | Tragic 7.8% |
| Cheyenne | 0.0 /100 | #329 | Tragic 7.8% |
Demographics Similar to Immigrants from Australia by Unemployment Among Ages 30 to 34 years
In terms of unemployment among ages 30 to 34 years, the demographic groups most similar to Immigrants from Australia are Bhutanese (5.2%, a difference of 0.010%), Immigrants from Kenya (5.2%, a difference of 0.040%), Immigrants from Sweden (5.2%, a difference of 0.050%), Immigrants from Egypt (5.2%, a difference of 0.11%), and Immigrants from Uganda (5.2%, a difference of 0.14%).
| Demographics | Rating | Rank | Unemployment Among Ages 30 to 34 years |
| Immigrants | Lithuania | 95.0 /100 | #79 | Exceptional 5.2% |
| Immigrants | Indonesia | 94.7 /100 | #80 | Exceptional 5.2% |
| Chileans | 94.4 /100 | #81 | Exceptional 5.2% |
| Immigrants | Latvia | 94.2 /100 | #82 | Exceptional 5.2% |
| Immigrants | Korea | 94.1 /100 | #83 | Exceptional 5.2% |
| Immigrants | Uganda | 94.0 /100 | #84 | Exceptional 5.2% |
| Immigrants | Egypt | 93.9 /100 | #85 | Exceptional 5.2% |
| Immigrants | Australia | 93.5 /100 | #86 | Exceptional 5.2% |
| Bhutanese | 93.5 /100 | #87 | Exceptional 5.2% |
| Immigrants | Kenya | 93.3 /100 | #88 | Exceptional 5.2% |
| Immigrants | Sweden | 93.3 /100 | #89 | Exceptional 5.2% |
| Immigrants | Romania | 92.8 /100 | #90 | Exceptional 5.2% |
| Iraqis | 92.6 /100 | #91 | Exceptional 5.2% |
| Immigrants | Argentina | 92.5 /100 | #92 | Exceptional 5.2% |
| Laotians | 92.4 /100 | #93 | Exceptional 5.2% |