Maltese vs Immigrants from Iran Unemployment Among Seniors over 65 years
COMPARE
Maltese
Immigrants from Iran
Unemployment Among Seniors over 65 years
Unemployment Among Seniors over 65 years Comparison
Maltese
Immigrants from Iran
5.2%
UNEMPLOYMENT AMONG SENIORS OVER 65 YEARS
19.6/ 100
METRIC RATING
198th/ 347
METRIC RANK
5.2%
UNEMPLOYMENT AMONG SENIORS OVER 65 YEARS
36.0/ 100
METRIC RATING
185th/ 347
METRIC RANK
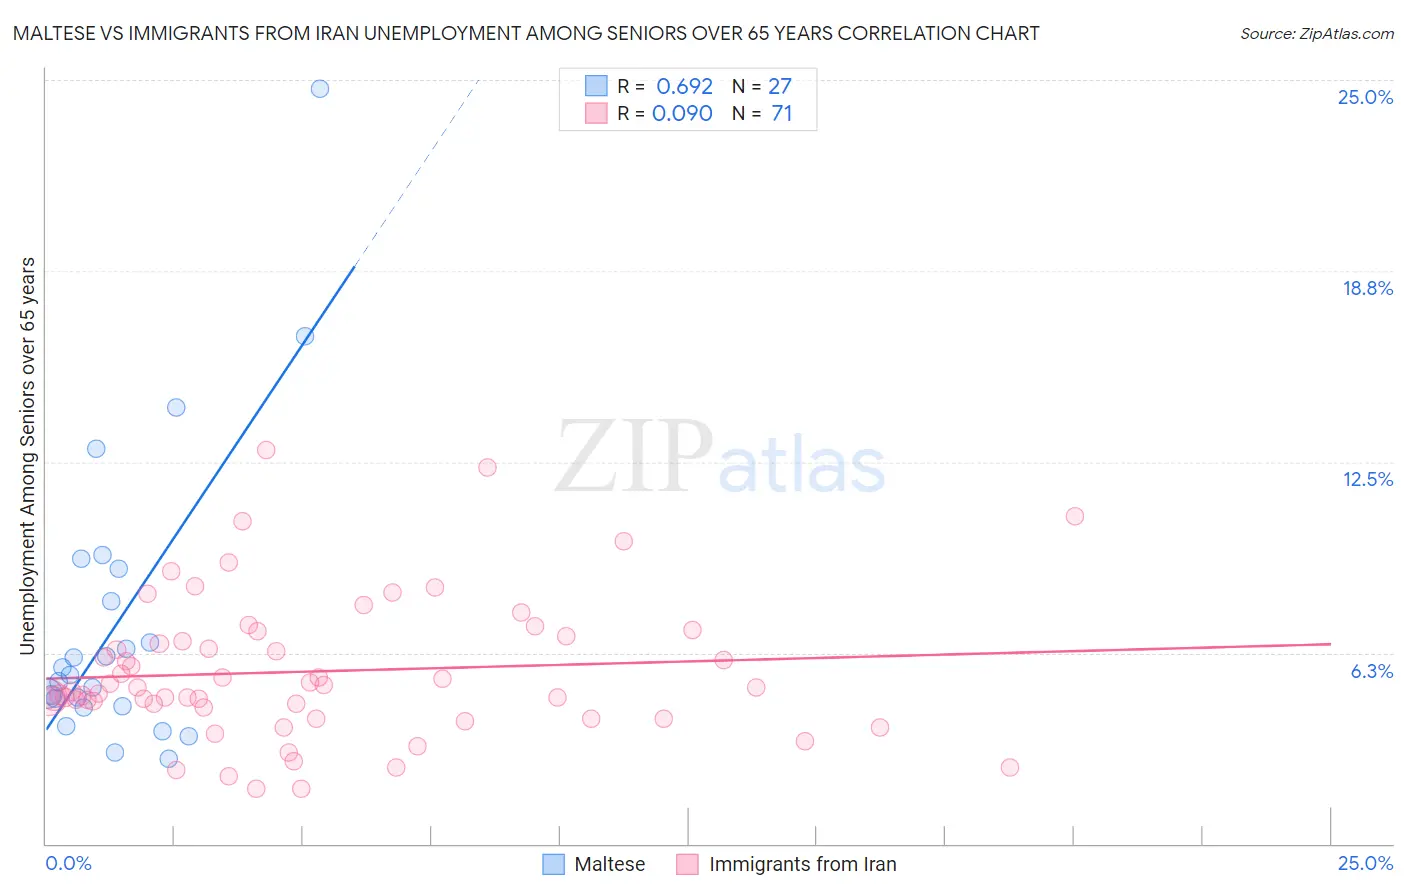
Maltese vs Immigrants from Iran Unemployment Among Seniors over 65 years Correlation Chart
The statistical analysis conducted on geographies consisting of 121,690,433 people shows a significant positive correlation between the proportion of Maltese and unemployment rate amomg seniors over the age of 65 in the United States with a correlation coefficient (R) of 0.692 and weighted average of 5.2%. Similarly, the statistical analysis conducted on geographies consisting of 264,234,718 people shows a slight positive correlation between the proportion of Immigrants from Iran and unemployment rate amomg seniors over the age of 65 in the United States with a correlation coefficient (R) of 0.090 and weighted average of 5.2%, a difference of 0.67%.
Unemployment Among Seniors over 65 years Correlation Summary
| Measurement | Maltese | Immigrants from Iran |
| Minimum | 2.8% | 1.8% |
| Maximum | 24.7% | 12.9% |
| Range | 21.9% | 11.1% |
| Mean | 7.3% | 5.6% |
| Median | 5.5% | 5.1% |
| Interquartile 25% (IQ1) | 4.5% | 4.4% |
| Interquartile 75% (IQ3) | 9.0% | 6.8% |
| Interquartile Range (IQR) | 4.5% | 2.4% |
| Standard Deviation (Sample) | 4.9% | 2.3% |
| Standard Deviation (Population) | 4.8% | 2.3% |
Demographics Similar to Maltese and Immigrants from Iran by Unemployment Among Seniors over 65 years
In terms of unemployment among seniors over 65 years, the demographic groups most similar to Maltese are Immigrants from Europe (5.2%, a difference of 0.030%), Immigrants from Pakistan (5.2%, a difference of 0.060%), Laotian (5.2%, a difference of 0.080%), Guamanian/Chamorro (5.2%, a difference of 0.14%), and Immigrants from Poland (5.2%, a difference of 0.22%). Similarly, the demographic groups most similar to Immigrants from Iran are American (5.2%, a difference of 0.030%), Somali (5.2%, a difference of 0.090%), Immigrants from Egypt (5.2%, a difference of 0.10%), Bangladeshi (5.2%, a difference of 0.13%), and Korean (5.2%, a difference of 0.16%).
| Demographics | Rating | Rank | Unemployment Among Seniors over 65 years |
| Immigrants | Italy | 43.5 /100 | #181 | Average 5.2% |
| Panamanians | 43.0 /100 | #182 | Average 5.2% |
| Immigrants | Western Asia | 42.1 /100 | #183 | Average 5.2% |
| Immigrants | Serbia | 41.6 /100 | #184 | Average 5.2% |
| Immigrants | Iran | 36.0 /100 | #185 | Fair 5.2% |
| Americans | 35.1 /100 | #186 | Fair 5.2% |
| Somalis | 33.5 /100 | #187 | Fair 5.2% |
| Immigrants | Egypt | 33.2 /100 | #188 | Fair 5.2% |
| Bangladeshis | 32.3 /100 | #189 | Fair 5.2% |
| Koreans | 31.6 /100 | #190 | Fair 5.2% |
| Immigrants | Denmark | 31.0 /100 | #191 | Fair 5.2% |
| Sioux | 30.8 /100 | #192 | Fair 5.2% |
| Immigrants | Africa | 29.6 /100 | #193 | Fair 5.2% |
| Argentineans | 29.1 /100 | #194 | Fair 5.2% |
| Costa Ricans | 27.0 /100 | #195 | Fair 5.2% |
| Immigrants | Poland | 24.3 /100 | #196 | Fair 5.2% |
| Guamanians/Chamorros | 22.5 /100 | #197 | Fair 5.2% |
| Maltese | 19.6 /100 | #198 | Poor 5.2% |
| Immigrants | Europe | 19.0 /100 | #199 | Poor 5.2% |
| Immigrants | Pakistan | 18.4 /100 | #200 | Poor 5.2% |
| Laotians | 18.1 /100 | #201 | Poor 5.2% |