Maltese vs Immigrants from Fiji Unemployment Among Women with Children Ages 6 to 17 years
COMPARE
Maltese
Immigrants from Fiji
Unemployment Among Women with Children Ages 6 to 17 years
Unemployment Among Women with Children Ages 6 to 17 years Comparison
Maltese
Immigrants from Fiji
9.1%
UNEMPLOYMENT AMONG WOMEN WITH CHILDREN AGES 6 TO 17 YEARS
15.3/ 100
METRIC RATING
203rd/ 347
METRIC RANK
7.3%
UNEMPLOYMENT AMONG WOMEN WITH CHILDREN AGES 6 TO 17 YEARS
100.0/ 100
METRIC RATING
10th/ 347
METRIC RANK
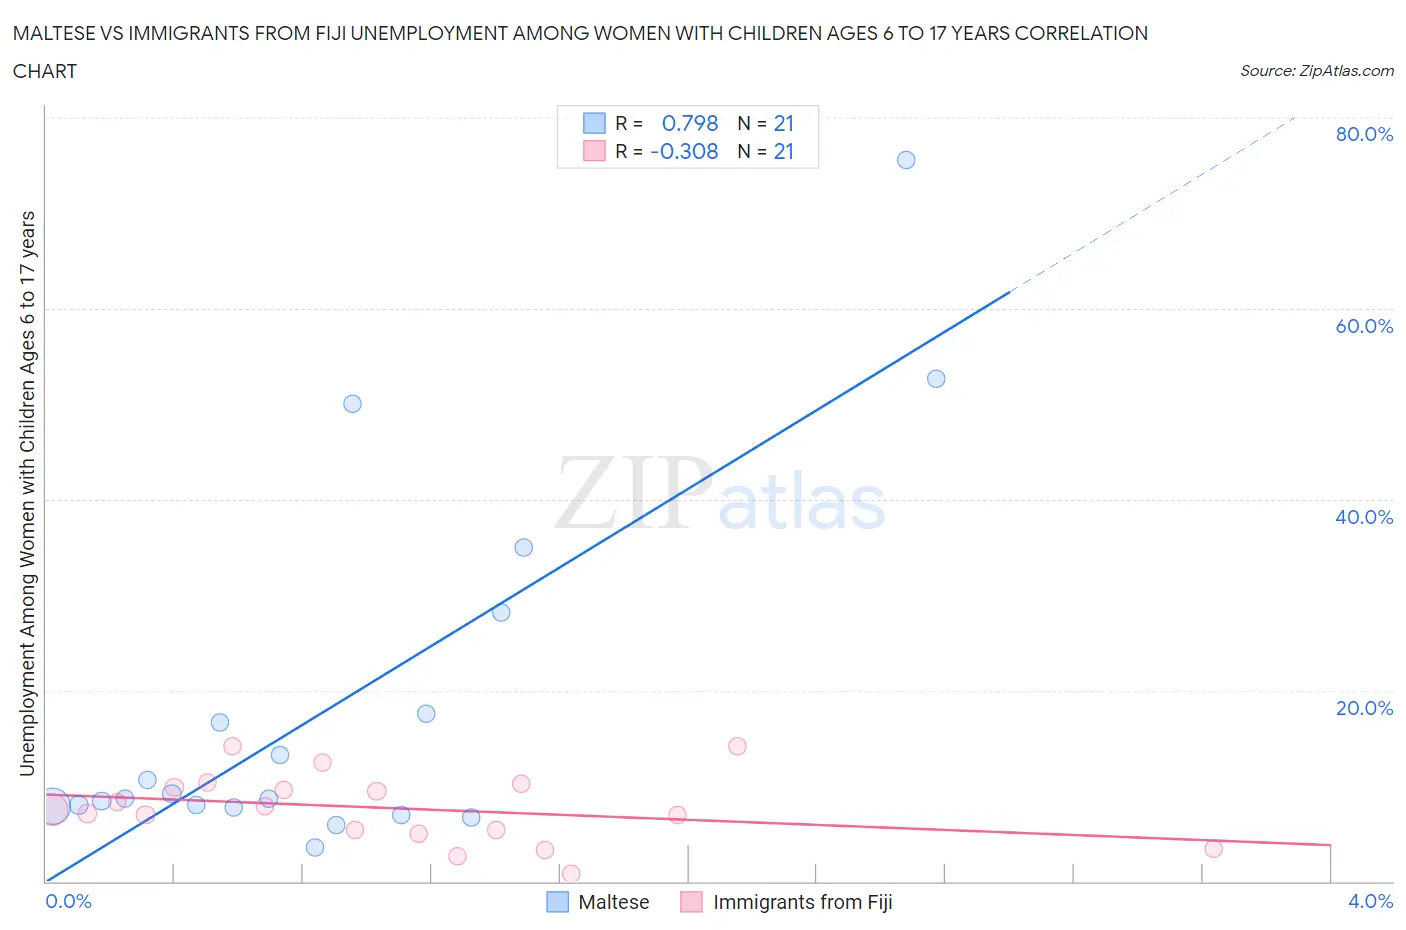
Maltese vs Immigrants from Fiji Unemployment Among Women with Children Ages 6 to 17 years Correlation Chart
The statistical analysis conducted on geographies consisting of 103,583,080 people shows a strong positive correlation between the proportion of Maltese and unemployment rate among women with children between the ages 6 and 17 in the United States with a correlation coefficient (R) of 0.798 and weighted average of 9.1%. Similarly, the statistical analysis conducted on geographies consisting of 84,843,445 people shows a mild negative correlation between the proportion of Immigrants from Fiji and unemployment rate among women with children between the ages 6 and 17 in the United States with a correlation coefficient (R) of -0.308 and weighted average of 7.3%, a difference of 25.5%.
Unemployment Among Women with Children Ages 6 to 17 years Correlation Summary
| Measurement | Maltese | Immigrants from Fiji |
| Minimum | 3.5% | 0.80% |
| Maximum | 75.5% | 14.1% |
| Range | 72.0% | 13.3% |
| Mean | 18.5% | 7.6% |
| Median | 8.7% | 7.5% |
| Interquartile 25% (IQ1) | 7.8% | 5.2% |
| Interquartile 75% (IQ3) | 22.8% | 10.0% |
| Interquartile Range (IQR) | 15.1% | 4.8% |
| Standard Deviation (Sample) | 19.2% | 3.6% |
| Standard Deviation (Population) | 18.7% | 3.5% |
Similar Demographics by Unemployment Among Women with Children Ages 6 to 17 years
Demographics Similar to Maltese by Unemployment Among Women with Children Ages 6 to 17 years
In terms of unemployment among women with children ages 6 to 17 years, the demographic groups most similar to Maltese are Immigrants from Canada (9.1%, a difference of 0.0%), Immigrants from Middle Africa (9.1%, a difference of 0.020%), Immigrants from Trinidad and Tobago (9.1%, a difference of 0.11%), Immigrants from Western Europe (9.1%, a difference of 0.11%), and Trinidadian and Tobagonian (9.1%, a difference of 0.22%).
| Demographics | Rating | Rank | Unemployment Among Women with Children Ages 6 to 17 years |
| Brazilians | 24.4 /100 | #196 | Fair 9.1% |
| Immigrants | Panama | 24.3 /100 | #197 | Fair 9.1% |
| Guyanese | 21.8 /100 | #198 | Fair 9.1% |
| Czechoslovakians | 20.8 /100 | #199 | Fair 9.1% |
| Trinidadians and Tobagonians | 18.2 /100 | #200 | Poor 9.1% |
| Immigrants | Trinidad and Tobago | 16.7 /100 | #201 | Poor 9.1% |
| Immigrants | Middle Africa | 15.6 /100 | #202 | Poor 9.1% |
| Maltese | 15.3 /100 | #203 | Poor 9.1% |
| Immigrants | Canada | 15.3 /100 | #204 | Poor 9.1% |
| Immigrants | Western Europe | 14.1 /100 | #205 | Poor 9.1% |
| Immigrants | North America | 12.7 /100 | #206 | Poor 9.2% |
| Cubans | 10.9 /100 | #207 | Poor 9.2% |
| Immigrants | Peru | 10.8 /100 | #208 | Poor 9.2% |
| Salvadorans | 10.7 /100 | #209 | Poor 9.2% |
| Finns | 10.0 /100 | #210 | Tragic 9.2% |
Demographics Similar to Immigrants from Fiji by Unemployment Among Women with Children Ages 6 to 17 years
In terms of unemployment among women with children ages 6 to 17 years, the demographic groups most similar to Immigrants from Fiji are Immigrants from Taiwan (7.3%, a difference of 0.70%), Assyrian/Chaldean/Syriac (7.2%, a difference of 0.97%), Bangladeshi (7.4%, a difference of 1.0%), Immigrants from Hong Kong (7.2%, a difference of 1.3%), and Indonesian (7.4%, a difference of 1.7%).
| Demographics | Rating | Rank | Unemployment Among Women with Children Ages 6 to 17 years |
| Tongans | 100.0 /100 | #3 | Exceptional 6.7% |
| Ute | 100.0 /100 | #4 | Exceptional 7.0% |
| Okinawans | 100.0 /100 | #5 | Exceptional 7.0% |
| Tlingit-Haida | 100.0 /100 | #6 | Exceptional 7.1% |
| Soviet Union | 100.0 /100 | #7 | Exceptional 7.1% |
| Immigrants | Hong Kong | 100.0 /100 | #8 | Exceptional 7.2% |
| Assyrians/Chaldeans/Syriacs | 100.0 /100 | #9 | Exceptional 7.2% |
| Immigrants | Fiji | 100.0 /100 | #10 | Exceptional 7.3% |
| Immigrants | Taiwan | 100.0 /100 | #11 | Exceptional 7.3% |
| Bangladeshis | 100.0 /100 | #12 | Exceptional 7.4% |
| Indonesians | 100.0 /100 | #13 | Exceptional 7.4% |
| Sudanese | 100.0 /100 | #14 | Exceptional 7.4% |
| Puget Sound Salish | 100.0 /100 | #15 | Exceptional 7.5% |
| Immigrants | Burma/Myanmar | 100.0 /100 | #16 | Exceptional 7.5% |
| Cambodians | 100.0 /100 | #17 | Exceptional 7.5% |