Malaysian vs Immigrants from Poland Unemployment Among Ages 45 to 54 years
COMPARE
Malaysian
Immigrants from Poland
Unemployment Among Ages 45 to 54 years
Unemployment Among Ages 45 to 54 years Comparison
Malaysians
Immigrants from Poland
4.5%
UNEMPLOYMENT AMONG AGES 45 TO 54 YEARS
47.5/ 100
METRIC RATING
180th/ 347
METRIC RANK
4.5%
UNEMPLOYMENT AMONG AGES 45 TO 54 YEARS
47.0/ 100
METRIC RATING
181st/ 347
METRIC RANK
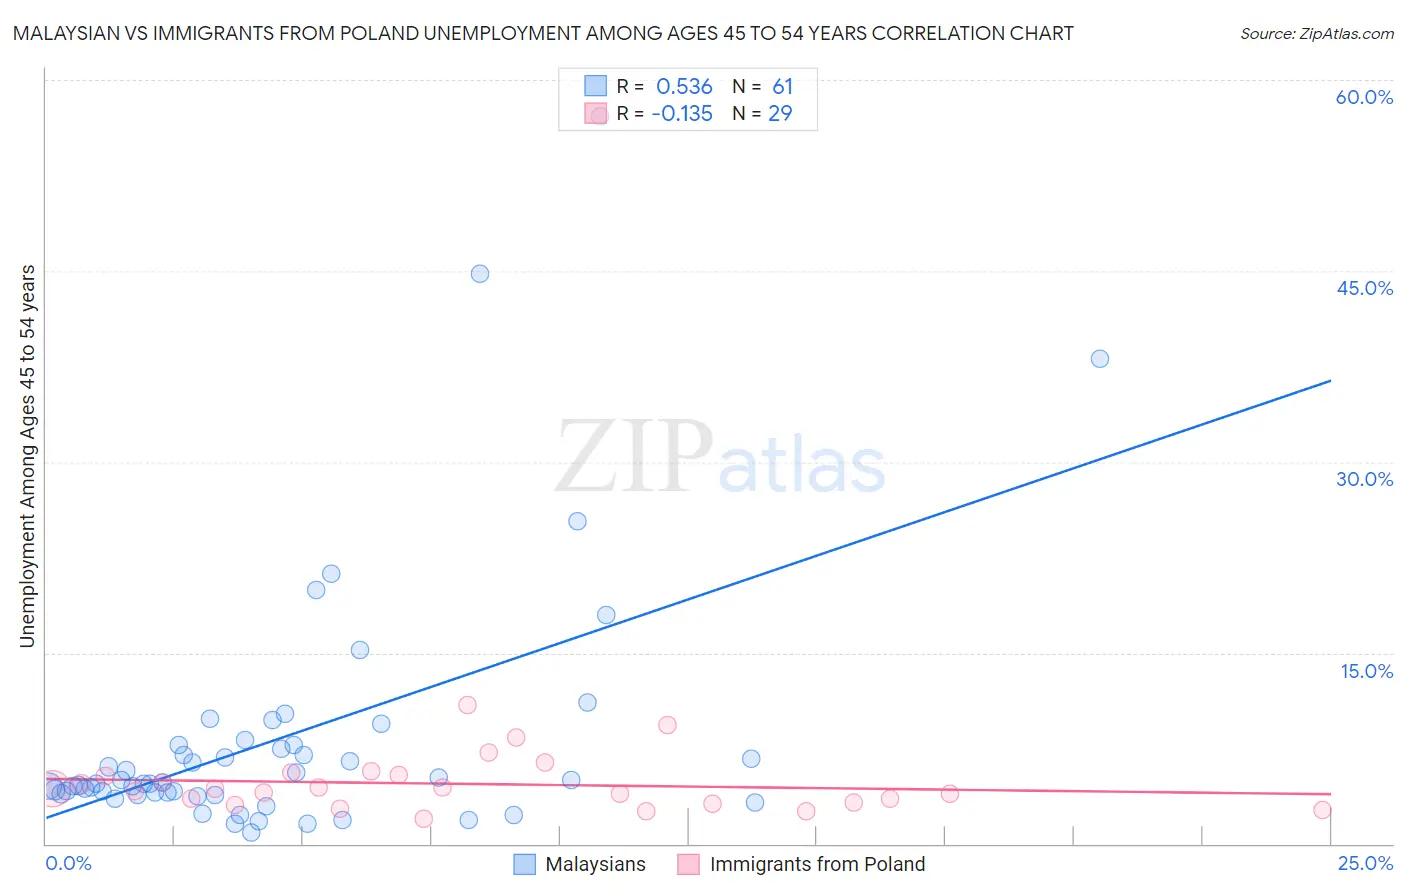
Malaysian vs Immigrants from Poland Unemployment Among Ages 45 to 54 years Correlation Chart
The statistical analysis conducted on geographies consisting of 223,132,257 people shows a substantial positive correlation between the proportion of Malaysians and unemployment rate among population between the ages 45 and 54 in the United States with a correlation coefficient (R) of 0.536 and weighted average of 4.5%. Similarly, the statistical analysis conducted on geographies consisting of 299,403,860 people shows a poor negative correlation between the proportion of Immigrants from Poland and unemployment rate among population between the ages 45 and 54 in the United States with a correlation coefficient (R) of -0.135 and weighted average of 4.5%, a difference of 0.020%.
Unemployment Among Ages 45 to 54 years Correlation Summary
| Measurement | Malaysian | Immigrants from Poland |
| Minimum | 0.90% | 2.0% |
| Maximum | 57.2% | 10.9% |
| Range | 56.3% | 8.9% |
| Mean | 8.3% | 4.7% |
| Median | 4.8% | 4.4% |
| Interquartile 25% (IQ1) | 3.9% | 3.2% |
| Interquartile 75% (IQ3) | 7.8% | 5.5% |
| Interquartile Range (IQR) | 3.9% | 2.4% |
| Standard Deviation (Sample) | 10.2% | 2.1% |
| Standard Deviation (Population) | 10.1% | 2.0% |
Demographics Similar to Malaysians and Immigrants from Poland by Unemployment Among Ages 45 to 54 years
In terms of unemployment among ages 45 to 54 years, the demographic groups most similar to Malaysians are Immigrants from Russia (4.5%, a difference of 0.030%), Immigrants from China (4.5%, a difference of 0.030%), Sierra Leonean (4.5%, a difference of 0.040%), Immigrants from Australia (4.5%, a difference of 0.050%), and Immigrants from Northern Africa (4.5%, a difference of 0.070%). Similarly, the demographic groups most similar to Immigrants from Poland are Immigrants from China (4.5%, a difference of 0.010%), Sierra Leonean (4.5%, a difference of 0.010%), Immigrants from Hong Kong (4.5%, a difference of 0.050%), Immigrants from Russia (4.5%, a difference of 0.060%), and Immigrants from Australia (4.5%, a difference of 0.070%).
| Demographics | Rating | Rank | Unemployment Among Ages 45 to 54 years |
| Spaniards | 54.3 /100 | #170 | Average 4.5% |
| Egyptians | 53.6 /100 | #171 | Average 4.5% |
| Colombians | 53.3 /100 | #172 | Average 4.5% |
| Immigrants | Colombia | 52.0 /100 | #173 | Average 4.5% |
| Immigrants | Hungary | 50.0 /100 | #174 | Average 4.5% |
| Immigrants | France | 49.4 /100 | #175 | Average 4.5% |
| Puget Sound Salish | 49.1 /100 | #176 | Average 4.5% |
| Immigrants | Northern Africa | 49.0 /100 | #177 | Average 4.5% |
| Immigrants | Australia | 48.5 /100 | #178 | Average 4.5% |
| Immigrants | Russia | 48.2 /100 | #179 | Average 4.5% |
| Malaysians | 47.5 /100 | #180 | Average 4.5% |
| Immigrants | Poland | 47.0 /100 | #181 | Average 4.5% |
| Immigrants | China | 46.7 /100 | #182 | Average 4.5% |
| Sierra Leoneans | 46.7 /100 | #183 | Average 4.5% |
| Immigrants | Hong Kong | 45.9 /100 | #184 | Average 4.5% |
| Immigrants | Philippines | 41.0 /100 | #185 | Average 4.5% |
| Hawaiians | 39.1 /100 | #186 | Fair 4.5% |
| Immigrants | Ukraine | 36.8 /100 | #187 | Fair 4.5% |
| Immigrants | Sierra Leone | 36.3 /100 | #188 | Fair 4.6% |
| Immigrants | Laos | 35.7 /100 | #189 | Fair 4.6% |
| Immigrants | Serbia | 34.8 /100 | #190 | Fair 4.6% |