Malaysian vs Bahamian Unemployment Among Women with Children Under 6 years
COMPARE
Malaysian
Bahamian
Unemployment Among Women with Children Under 6 years
Unemployment Among Women with Children Under 6 years Comparison
Malaysians
Bahamians
7.7%
UNEMPLOYMENT AMONG WOMEN WITH CHILDREN UNDER 6 YEARS
31.1/ 100
METRIC RATING
195th/ 347
METRIC RANK
8.7%
UNEMPLOYMENT AMONG WOMEN WITH CHILDREN UNDER 6 YEARS
0.0/ 100
METRIC RATING
288th/ 347
METRIC RANK
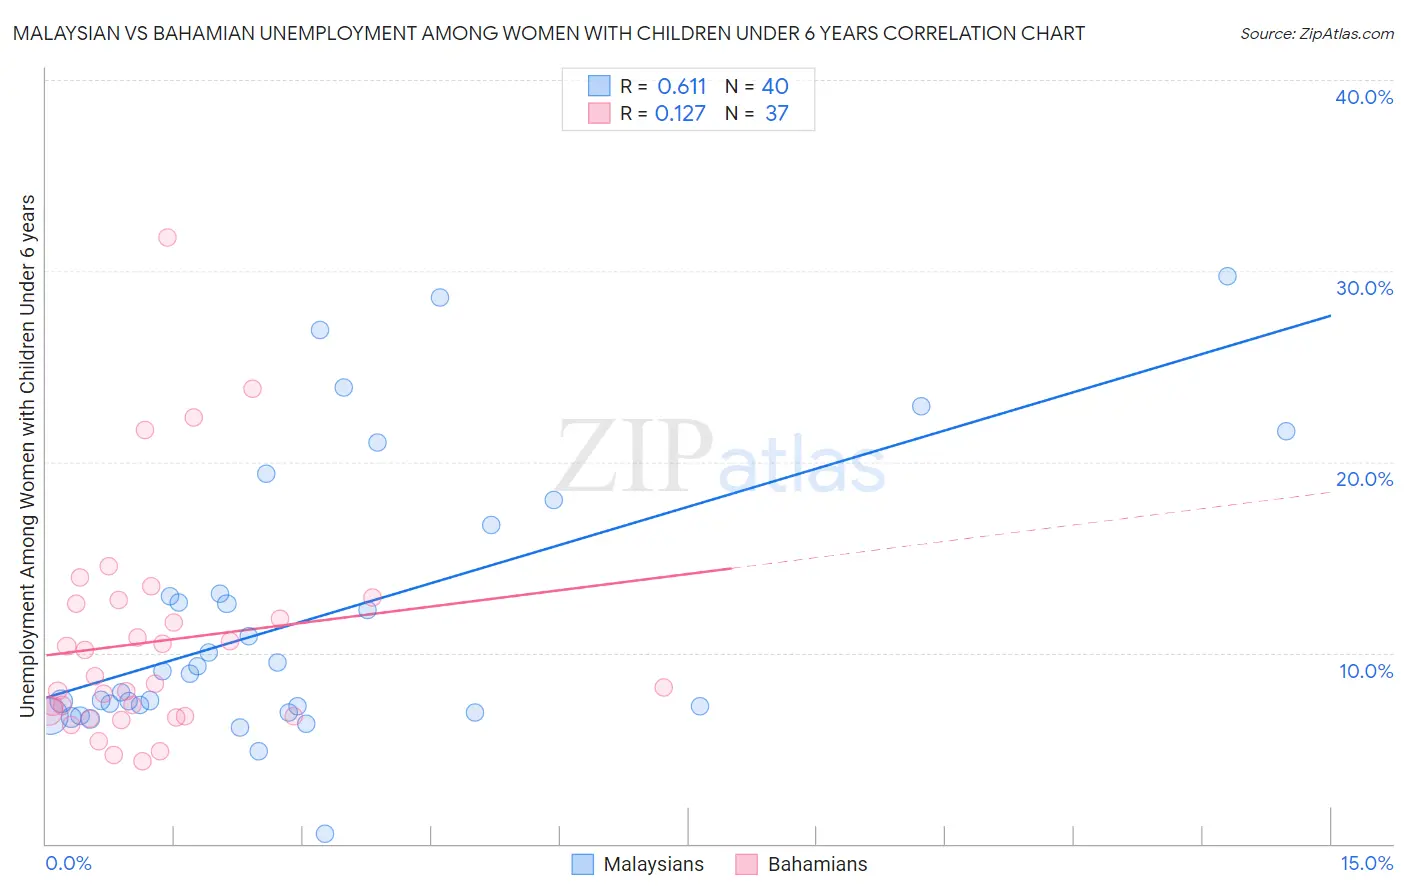
Malaysian vs Bahamian Unemployment Among Women with Children Under 6 years Correlation Chart
The statistical analysis conducted on geographies consisting of 189,834,116 people shows a significant positive correlation between the proportion of Malaysians and unemployment rate among women with children under the age of 6 in the United States with a correlation coefficient (R) of 0.611 and weighted average of 7.7%. Similarly, the statistical analysis conducted on geographies consisting of 100,229,673 people shows a poor positive correlation between the proportion of Bahamians and unemployment rate among women with children under the age of 6 in the United States with a correlation coefficient (R) of 0.127 and weighted average of 8.7%, a difference of 12.7%.
Unemployment Among Women with Children Under 6 years Correlation Summary
| Measurement | Malaysian | Bahamian |
| Minimum | 0.50% | 4.3% |
| Maximum | 29.7% | 31.8% |
| Range | 29.2% | 27.5% |
| Mean | 11.9% | 10.6% |
| Median | 9.0% | 8.4% |
| Interquartile 25% (IQ1) | 7.0% | 6.7% |
| Interquartile 75% (IQ3) | 14.9% | 12.7% |
| Interquartile Range (IQR) | 7.8% | 6.0% |
| Standard Deviation (Sample) | 7.2% | 5.9% |
| Standard Deviation (Population) | 7.1% | 5.8% |
Similar Demographics by Unemployment Among Women with Children Under 6 years
Demographics Similar to Malaysians by Unemployment Among Women with Children Under 6 years
In terms of unemployment among women with children under 6 years, the demographic groups most similar to Malaysians are Immigrants from St. Vincent and the Grenadines (7.7%, a difference of 0.0%), Syrian (7.7%, a difference of 0.060%), Italian (7.7%, a difference of 0.060%), Lithuanian (7.8%, a difference of 0.090%), and Immigrants from Austria (7.7%, a difference of 0.10%).
| Demographics | Rating | Rank | Unemployment Among Women with Children Under 6 years |
| Czechoslovakians | 38.4 /100 | #188 | Fair 7.7% |
| Immigrants | Panama | 35.7 /100 | #189 | Fair 7.7% |
| Immigrants | North Macedonia | 34.4 /100 | #190 | Fair 7.7% |
| Immigrants | Austria | 32.4 /100 | #191 | Fair 7.7% |
| Immigrants | Africa | 32.4 /100 | #192 | Fair 7.7% |
| Slavs | 32.4 /100 | #193 | Fair 7.7% |
| Syrians | 31.9 /100 | #194 | Fair 7.7% |
| Malaysians | 31.1 /100 | #195 | Fair 7.7% |
| Immigrants | St. Vincent and the Grenadines | 31.1 /100 | #196 | Fair 7.7% |
| Italians | 30.4 /100 | #197 | Fair 7.7% |
| Lithuanians | 30.0 /100 | #198 | Fair 7.8% |
| Immigrants | Poland | 27.3 /100 | #199 | Fair 7.8% |
| Guamanians/Chamorros | 25.5 /100 | #200 | Fair 7.8% |
| Basques | 24.7 /100 | #201 | Fair 7.8% |
| Sudanese | 23.5 /100 | #202 | Fair 7.8% |
Demographics Similar to Bahamians by Unemployment Among Women with Children Under 6 years
In terms of unemployment among women with children under 6 years, the demographic groups most similar to Bahamians are Iroquois (8.7%, a difference of 0.11%), Menominee (8.7%, a difference of 0.20%), Vietnamese (8.8%, a difference of 0.26%), U.S. Virgin Islander (8.7%, a difference of 0.35%), and Seminole (8.7%, a difference of 0.35%).
| Demographics | Rating | Rank | Unemployment Among Women with Children Under 6 years |
| Guatemalans | 0.0 /100 | #281 | Tragic 8.7% |
| Bermudans | 0.0 /100 | #282 | Tragic 8.7% |
| Spanish American Indians | 0.0 /100 | #283 | Tragic 8.7% |
| Blackfeet | 0.0 /100 | #284 | Tragic 8.7% |
| U.S. Virgin Islanders | 0.0 /100 | #285 | Tragic 8.7% |
| Seminole | 0.0 /100 | #286 | Tragic 8.7% |
| Menominee | 0.0 /100 | #287 | Tragic 8.7% |
| Bahamians | 0.0 /100 | #288 | Tragic 8.7% |
| Iroquois | 0.0 /100 | #289 | Tragic 8.7% |
| Vietnamese | 0.0 /100 | #290 | Tragic 8.8% |
| Jamaicans | 0.0 /100 | #291 | Tragic 8.8% |
| Cheyenne | 0.0 /100 | #292 | Tragic 8.8% |
| Immigrants | Bangladesh | 0.0 /100 | #293 | Tragic 8.8% |
| Immigrants | Nonimmigrants | 0.0 /100 | #294 | Tragic 8.8% |
| Immigrants | Central America | 0.0 /100 | #295 | Tragic 8.9% |