Macedonian vs Immigrants from Vietnam Unemployment Among Ages 45 to 54 years
COMPARE
Macedonian
Immigrants from Vietnam
Unemployment Among Ages 45 to 54 years
Unemployment Among Ages 45 to 54 years Comparison
Macedonians
Immigrants from Vietnam
4.5%
UNEMPLOYMENT AMONG AGES 45 TO 54 YEARS
79.0/ 100
METRIC RATING
143rd/ 347
METRIC RANK
4.4%
UNEMPLOYMENT AMONG AGES 45 TO 54 YEARS
88.6/ 100
METRIC RATING
125th/ 347
METRIC RANK
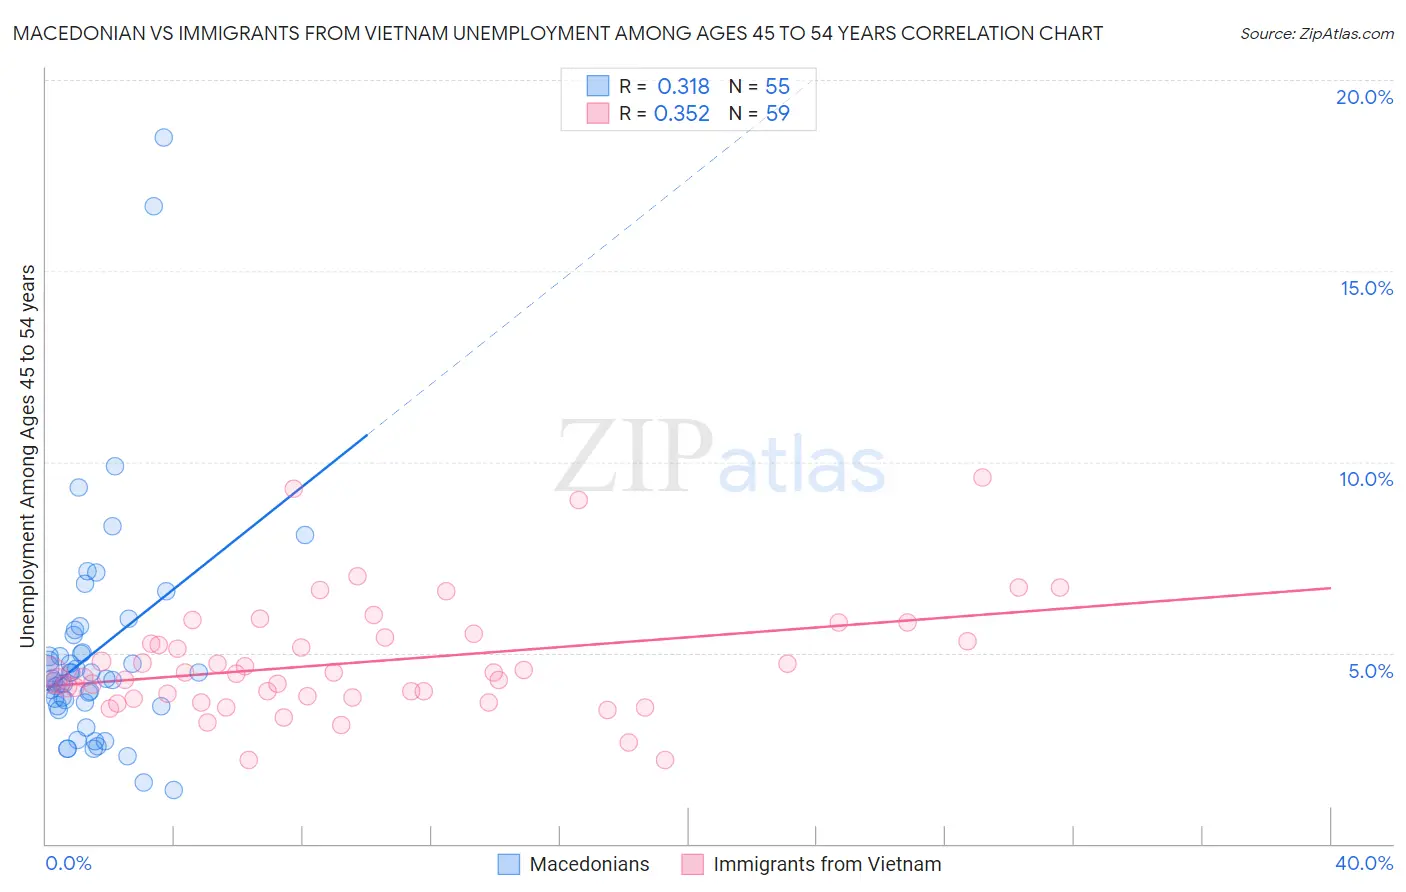
Macedonian vs Immigrants from Vietnam Unemployment Among Ages 45 to 54 years Correlation Chart
The statistical analysis conducted on geographies consisting of 131,025,717 people shows a mild positive correlation between the proportion of Macedonians and unemployment rate among population between the ages 45 and 54 in the United States with a correlation coefficient (R) of 0.318 and weighted average of 4.5%. Similarly, the statistical analysis conducted on geographies consisting of 395,419,223 people shows a mild positive correlation between the proportion of Immigrants from Vietnam and unemployment rate among population between the ages 45 and 54 in the United States with a correlation coefficient (R) of 0.352 and weighted average of 4.4%, a difference of 0.87%.
Unemployment Among Ages 45 to 54 years Correlation Summary
| Measurement | Macedonian | Immigrants from Vietnam |
| Minimum | 1.4% | 2.2% |
| Maximum | 18.5% | 9.6% |
| Range | 17.1% | 7.4% |
| Mean | 5.0% | 4.8% |
| Median | 4.3% | 4.4% |
| Interquartile 25% (IQ1) | 3.6% | 3.8% |
| Interquartile 75% (IQ3) | 5.5% | 5.4% |
| Interquartile Range (IQR) | 1.9% | 1.6% |
| Standard Deviation (Sample) | 3.0% | 1.5% |
| Standard Deviation (Population) | 3.0% | 1.5% |
Demographics Similar to Macedonians and Immigrants from Vietnam by Unemployment Among Ages 45 to 54 years
In terms of unemployment among ages 45 to 54 years, the demographic groups most similar to Macedonians are Immigrants from Netherlands (4.4%, a difference of 0.030%), Immigrants from Afghanistan (4.4%, a difference of 0.040%), Taiwanese (4.5%, a difference of 0.080%), Immigrants from Zaire (4.4%, a difference of 0.12%), and Immigrants from Kuwait (4.4%, a difference of 0.20%). Similarly, the demographic groups most similar to Immigrants from Vietnam are Spanish (4.4%, a difference of 0.020%), Immigrants from Czechoslovakia (4.4%, a difference of 0.10%), Nicaraguan (4.4%, a difference of 0.11%), Immigrants from Northern Europe (4.4%, a difference of 0.19%), and Laotian (4.4%, a difference of 0.25%).
| Demographics | Rating | Rank | Unemployment Among Ages 45 to 54 years |
| Spanish | 88.8 /100 | #124 | Excellent 4.4% |
| Immigrants | Vietnam | 88.6 /100 | #125 | Excellent 4.4% |
| Immigrants | Czechoslovakia | 87.8 /100 | #126 | Excellent 4.4% |
| Nicaraguans | 87.6 /100 | #127 | Excellent 4.4% |
| Immigrants | Northern Europe | 86.9 /100 | #128 | Excellent 4.4% |
| Laotians | 86.3 /100 | #129 | Excellent 4.4% |
| Celtics | 86.2 /100 | #130 | Excellent 4.4% |
| Immigrants | Germany | 85.9 /100 | #131 | Excellent 4.4% |
| Immigrants | Eastern Africa | 85.1 /100 | #132 | Excellent 4.4% |
| Immigrants | Cameroon | 84.8 /100 | #133 | Excellent 4.4% |
| Afghans | 84.6 /100 | #134 | Excellent 4.4% |
| Immigrants | Eastern Asia | 84.0 /100 | #135 | Excellent 4.4% |
| Immigrants | Middle Africa | 83.3 /100 | #136 | Excellent 4.4% |
| Lebanese | 81.9 /100 | #137 | Excellent 4.4% |
| Immigrants | Congo | 81.8 /100 | #138 | Excellent 4.4% |
| Immigrants | Kuwait | 81.7 /100 | #139 | Excellent 4.4% |
| Immigrants | Zaire | 80.7 /100 | #140 | Excellent 4.4% |
| Immigrants | Afghanistan | 79.6 /100 | #141 | Good 4.4% |
| Immigrants | Netherlands | 79.4 /100 | #142 | Good 4.4% |
| Macedonians | 79.0 /100 | #143 | Good 4.5% |
| Taiwanese | 77.9 /100 | #144 | Good 4.5% |