Macedonian vs Immigrants from Dominican Republic Unemployment Among Ages 16 to 19 years
COMPARE
Macedonian
Immigrants from Dominican Republic
Unemployment Among Ages 16 to 19 years
Unemployment Among Ages 16 to 19 years Comparison
Macedonians
Immigrants from Dominican Republic
16.6%
UNEMPLOYMENT AMONG AGES 16 TO 19 YEARS
99.2/ 100
METRIC RATING
62nd/ 347
METRIC RANK
23.3%
UNEMPLOYMENT AMONG AGES 16 TO 19 YEARS
0.0/ 100
METRIC RATING
328th/ 347
METRIC RANK
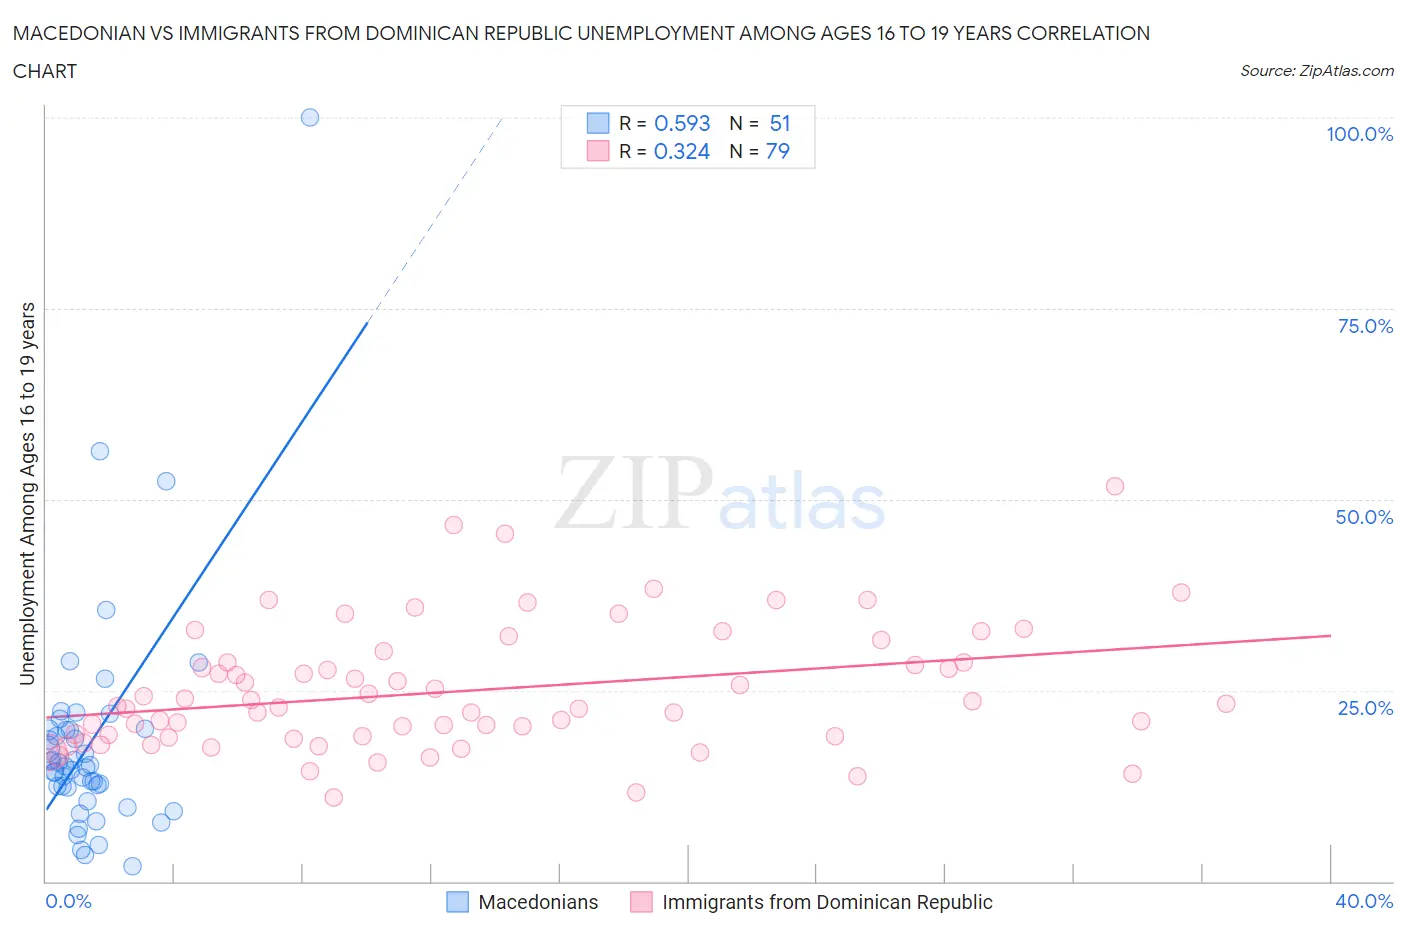
Macedonian vs Immigrants from Dominican Republic Unemployment Among Ages 16 to 19 years Correlation Chart
The statistical analysis conducted on geographies consisting of 129,038,404 people shows a substantial positive correlation between the proportion of Macedonians and unemployment rate among population between the ages 16 and 19 in the United States with a correlation coefficient (R) of 0.593 and weighted average of 16.6%. Similarly, the statistical analysis conducted on geographies consisting of 263,508,532 people shows a mild positive correlation between the proportion of Immigrants from Dominican Republic and unemployment rate among population between the ages 16 and 19 in the United States with a correlation coefficient (R) of 0.324 and weighted average of 23.3%, a difference of 40.6%.
Unemployment Among Ages 16 to 19 years Correlation Summary
| Measurement | Macedonian | Immigrants from Dominican Republic |
| Minimum | 2.0% | 10.9% |
| Maximum | 100.0% | 51.7% |
| Range | 98.0% | 40.8% |
| Mean | 18.3% | 24.9% |
| Median | 15.0% | 22.9% |
| Interquartile 25% (IQ1) | 12.3% | 18.9% |
| Interquartile 75% (IQ3) | 19.9% | 28.7% |
| Interquartile Range (IQR) | 7.6% | 9.8% |
| Standard Deviation (Sample) | 15.5% | 8.2% |
| Standard Deviation (Population) | 15.3% | 8.1% |
Similar Demographics by Unemployment Among Ages 16 to 19 years
Demographics Similar to Macedonians by Unemployment Among Ages 16 to 19 years
In terms of unemployment among ages 16 to 19 years, the demographic groups most similar to Macedonians are Immigrants from Cuba (16.6%, a difference of 0.10%), Menominee (16.6%, a difference of 0.16%), Scotch-Irish (16.6%, a difference of 0.18%), Northern European (16.6%, a difference of 0.25%), and Irish (16.5%, a difference of 0.33%).
| Demographics | Rating | Rank | Unemployment Among Ages 16 to 19 years |
| Czechoslovakians | 99.5 /100 | #55 | Exceptional 16.5% |
| Sri Lankans | 99.5 /100 | #56 | Exceptional 16.5% |
| Immigrants | Jordan | 99.4 /100 | #57 | Exceptional 16.5% |
| Immigrants | Uganda | 99.4 /100 | #58 | Exceptional 16.5% |
| Irish | 99.4 /100 | #59 | Exceptional 16.5% |
| Menominee | 99.3 /100 | #60 | Exceptional 16.6% |
| Immigrants | Cuba | 99.2 /100 | #61 | Exceptional 16.6% |
| Macedonians | 99.2 /100 | #62 | Exceptional 16.6% |
| Scotch-Irish | 99.1 /100 | #63 | Exceptional 16.6% |
| Northern Europeans | 99.0 /100 | #64 | Exceptional 16.6% |
| Immigrants | Japan | 98.9 /100 | #65 | Exceptional 16.6% |
| Okinawans | 98.9 /100 | #66 | Exceptional 16.6% |
| Slavs | 98.7 /100 | #67 | Exceptional 16.7% |
| Chickasaw | 98.7 /100 | #68 | Exceptional 16.7% |
| Serbians | 98.7 /100 | #69 | Exceptional 16.7% |
Demographics Similar to Immigrants from Dominican Republic by Unemployment Among Ages 16 to 19 years
In terms of unemployment among ages 16 to 19 years, the demographic groups most similar to Immigrants from Dominican Republic are Pima (23.1%, a difference of 0.66%), Immigrants from Trinidad and Tobago (23.1%, a difference of 0.93%), Tlingit-Haida (23.5%, a difference of 1.1%), Dominican (23.6%, a difference of 1.5%), and British West Indian (24.0%, a difference of 2.9%).
| Demographics | Rating | Rank | Unemployment Among Ages 16 to 19 years |
| West Indians | 0.0 /100 | #321 | Tragic 22.4% |
| Barbadians | 0.0 /100 | #322 | Tragic 22.5% |
| Yakama | 0.0 /100 | #323 | Tragic 22.5% |
| Immigrants | Armenia | 0.0 /100 | #324 | Tragic 22.6% |
| Trinidadians and Tobagonians | 0.0 /100 | #325 | Tragic 22.6% |
| Immigrants | Trinidad and Tobago | 0.0 /100 | #326 | Tragic 23.1% |
| Pima | 0.0 /100 | #327 | Tragic 23.1% |
| Immigrants | Dominican Republic | 0.0 /100 | #328 | Tragic 23.3% |
| Tlingit-Haida | 0.0 /100 | #329 | Tragic 23.5% |
| Dominicans | 0.0 /100 | #330 | Tragic 23.6% |
| British West Indians | 0.0 /100 | #331 | Tragic 24.0% |
| Immigrants | Barbados | 0.0 /100 | #332 | Tragic 24.0% |
| Paiute | 0.0 /100 | #333 | Tragic 24.4% |
| Guyanese | 0.0 /100 | #334 | Tragic 24.8% |
| Arapaho | 0.0 /100 | #335 | Tragic 25.2% |