Luxembourger vs Immigrants from South Africa Unemployment Among Ages 60 to 64 years
COMPARE
Luxembourger
Immigrants from South Africa
Unemployment Among Ages 60 to 64 years
Unemployment Among Ages 60 to 64 years Comparison
Luxembourgers
Immigrants from South Africa
4.3%
UNEMPLOYMENT AMONG AGES 60 TO 64 YEARS
100.0/ 100
METRIC RATING
11th/ 347
METRIC RANK
4.8%
UNEMPLOYMENT AMONG AGES 60 TO 64 YEARS
78.5/ 100
METRIC RATING
151st/ 347
METRIC RANK
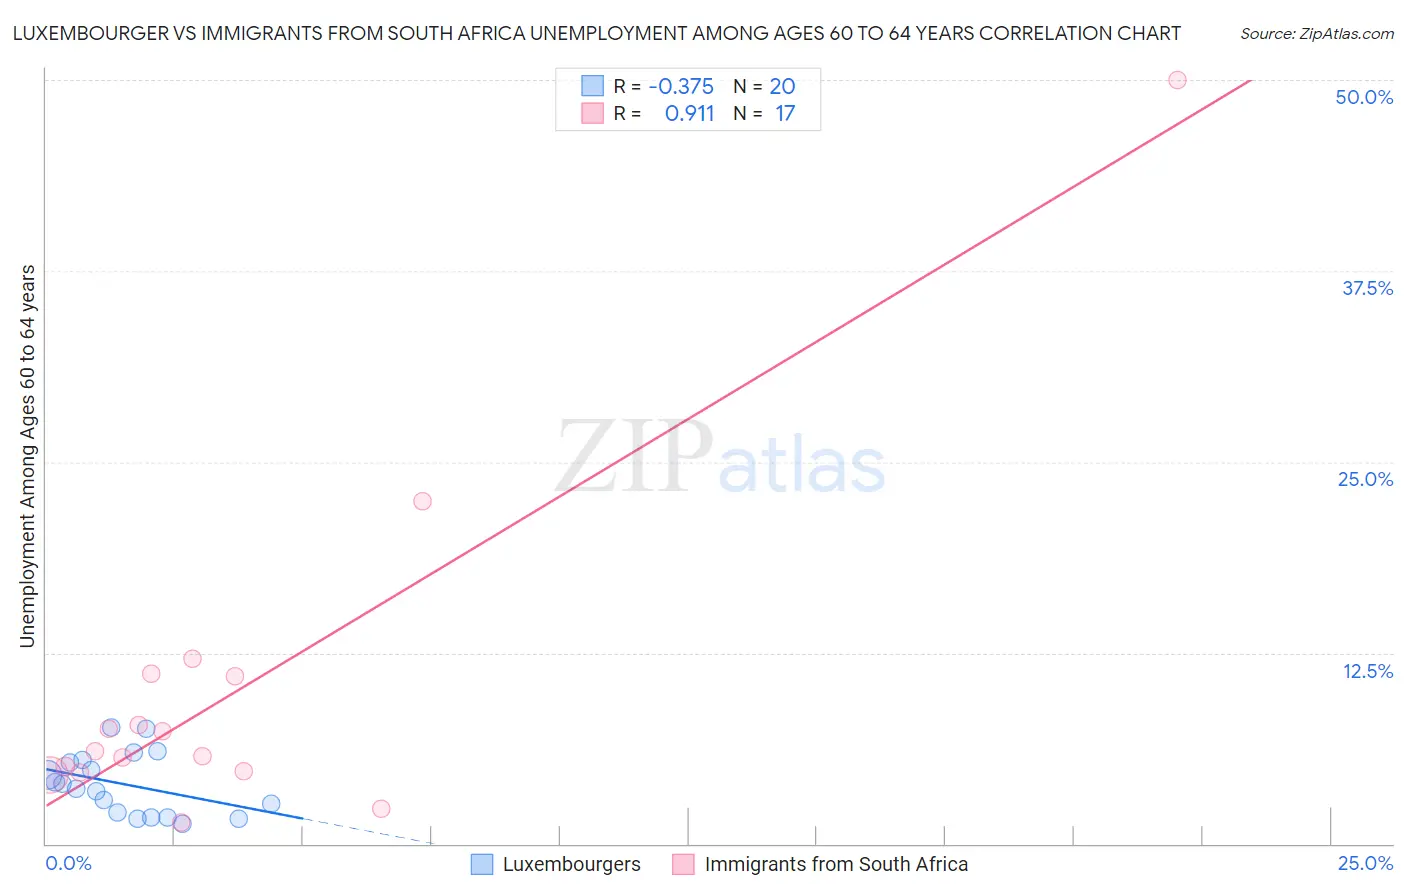
Luxembourger vs Immigrants from South Africa Unemployment Among Ages 60 to 64 years Correlation Chart
The statistical analysis conducted on geographies consisting of 136,276,430 people shows a mild negative correlation between the proportion of Luxembourgers and unemployment rate among population between the ages 60 and 64 in the United States with a correlation coefficient (R) of -0.375 and weighted average of 4.3%. Similarly, the statistical analysis conducted on geographies consisting of 218,943,576 people shows a near-perfect positive correlation between the proportion of Immigrants from South Africa and unemployment rate among population between the ages 60 and 64 in the United States with a correlation coefficient (R) of 0.911 and weighted average of 4.8%, a difference of 12.2%.
Unemployment Among Ages 60 to 64 years Correlation Summary
| Measurement | Luxembourger | Immigrants from South Africa |
| Minimum | 1.3% | 1.4% |
| Maximum | 7.6% | 50.0% |
| Range | 6.3% | 48.6% |
| Mean | 3.9% | 10.0% |
| Median | 3.8% | 6.1% |
| Interquartile 25% (IQ1) | 1.9% | 4.7% |
| Interquartile 75% (IQ3) | 5.4% | 11.0% |
| Interquartile Range (IQR) | 3.5% | 6.3% |
| Standard Deviation (Sample) | 2.0% | 11.4% |
| Standard Deviation (Population) | 1.9% | 11.0% |
Similar Demographics by Unemployment Among Ages 60 to 64 years
Demographics Similar to Luxembourgers by Unemployment Among Ages 60 to 64 years
In terms of unemployment among ages 60 to 64 years, the demographic groups most similar to Luxembourgers are Immigrants from Bosnia and Herzegovina (4.2%, a difference of 0.74%), Immigrants from Cuba (4.3%, a difference of 1.0%), Chickasaw (4.3%, a difference of 1.0%), Norwegian (4.3%, a difference of 1.1%), and Indonesian (4.2%, a difference of 1.1%).
| Demographics | Rating | Rank | Unemployment Among Ages 60 to 64 years |
| Hmong | 100.0 /100 | #4 | Exceptional 4.0% |
| Immigrants | Azores | 100.0 /100 | #5 | Exceptional 4.0% |
| Immigrants | Congo | 100.0 /100 | #6 | Exceptional 4.1% |
| Lumbee | 100.0 /100 | #7 | Exceptional 4.2% |
| Immigrants | Micronesia | 100.0 /100 | #8 | Exceptional 4.2% |
| Indonesians | 100.0 /100 | #9 | Exceptional 4.2% |
| Immigrants | Bosnia and Herzegovina | 100.0 /100 | #10 | Exceptional 4.2% |
| Luxembourgers | 100.0 /100 | #11 | Exceptional 4.3% |
| Immigrants | Cuba | 100.0 /100 | #12 | Exceptional 4.3% |
| Chickasaw | 100.0 /100 | #13 | Exceptional 4.3% |
| Norwegians | 100.0 /100 | #14 | Exceptional 4.3% |
| Sudanese | 100.0 /100 | #15 | Exceptional 4.3% |
| Danes | 100.0 /100 | #16 | Exceptional 4.4% |
| Immigrants | Afghanistan | 100.0 /100 | #17 | Exceptional 4.4% |
| Slovenes | 100.0 /100 | #18 | Exceptional 4.4% |
Demographics Similar to Immigrants from South Africa by Unemployment Among Ages 60 to 64 years
In terms of unemployment among ages 60 to 64 years, the demographic groups most similar to Immigrants from South Africa are Immigrants from Italy (4.8%, a difference of 0.010%), Arab (4.8%, a difference of 0.020%), Latvian (4.8%, a difference of 0.030%), American (4.8%, a difference of 0.14%), and Mongolian (4.8%, a difference of 0.15%).
| Demographics | Rating | Rank | Unemployment Among Ages 60 to 64 years |
| Immigrants | Pakistan | 83.3 /100 | #144 | Excellent 4.8% |
| Burmese | 83.1 /100 | #145 | Excellent 4.8% |
| Turks | 81.9 /100 | #146 | Excellent 4.8% |
| Mongolians | 81.2 /100 | #147 | Excellent 4.8% |
| Latvians | 79.1 /100 | #148 | Good 4.8% |
| Arabs | 78.8 /100 | #149 | Good 4.8% |
| Immigrants | Italy | 78.7 /100 | #150 | Good 4.8% |
| Immigrants | South Africa | 78.5 /100 | #151 | Good 4.8% |
| Americans | 75.7 /100 | #152 | Good 4.8% |
| Bolivians | 75.5 /100 | #153 | Good 4.8% |
| Chileans | 72.6 /100 | #154 | Good 4.8% |
| Filipinos | 72.1 /100 | #155 | Good 4.8% |
| Immigrants | Bolivia | 69.2 /100 | #156 | Good 4.8% |
| Laotians | 66.8 /100 | #157 | Good 4.8% |
| Immigrants | Taiwan | 66.0 /100 | #158 | Good 4.8% |