Lumbee vs Tlingit-Haida Unemployment Among Youth under 25 years
COMPARE
Lumbee
Tlingit-Haida
Unemployment Among Youth under 25 years
Unemployment Among Youth under 25 years Comparison
Lumbee
Tlingit-Haida
13.3%
UNEMPLOYMENT AMONG YOUTH UNDER 25 YEARS
0.0/ 100
METRIC RATING
284th/ 347
METRIC RANK
12.7%
UNEMPLOYMENT AMONG YOUTH UNDER 25 YEARS
0.0/ 100
METRIC RATING
268th/ 347
METRIC RANK
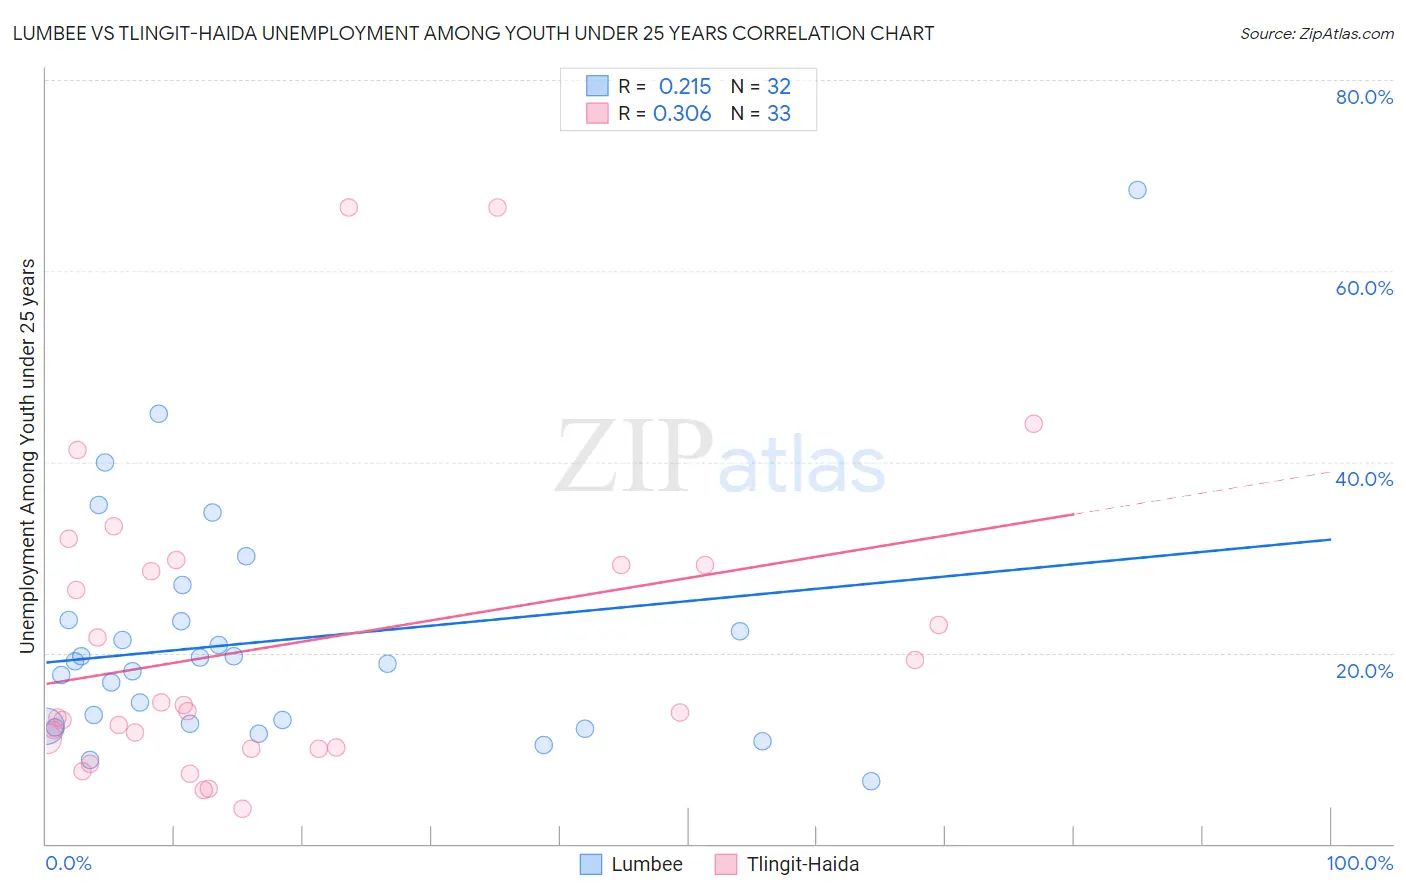
Lumbee vs Tlingit-Haida Unemployment Among Youth under 25 years Correlation Chart
The statistical analysis conducted on geographies consisting of 91,748,862 people shows a weak positive correlation between the proportion of Lumbee and unemployment rate among youth under the age of 25 in the United States with a correlation coefficient (R) of 0.215 and weighted average of 13.3%. Similarly, the statistical analysis conducted on geographies consisting of 60,635,463 people shows a mild positive correlation between the proportion of Tlingit-Haida and unemployment rate among youth under the age of 25 in the United States with a correlation coefficient (R) of 0.306 and weighted average of 12.7%, a difference of 5.0%.
Unemployment Among Youth under 25 years Correlation Summary
| Measurement | Lumbee | Tlingit-Haida |
| Minimum | 6.5% | 3.7% |
| Maximum | 68.5% | 66.6% |
| Range | 62.0% | 62.9% |
| Mean | 21.2% | 20.9% |
| Median | 18.9% | 13.9% |
| Interquartile 25% (IQ1) | 12.5% | 10.1% |
| Interquartile 75% (IQ3) | 23.4% | 29.2% |
| Interquartile Range (IQR) | 11.0% | 19.1% |
| Standard Deviation (Sample) | 12.6% | 15.8% |
| Standard Deviation (Population) | 12.4% | 15.6% |
Demographics Similar to Lumbee and Tlingit-Haida by Unemployment Among Youth under 25 years
In terms of unemployment among youth under 25 years, the demographic groups most similar to Lumbee are Immigrants from Cameroon (13.3%, a difference of 0.010%), Sierra Leonean (13.3%, a difference of 0.040%), Armenian (13.3%, a difference of 0.050%), Ute (13.3%, a difference of 0.080%), and Ghanaian (13.3%, a difference of 0.090%). Similarly, the demographic groups most similar to Tlingit-Haida are Subsaharan African (12.6%, a difference of 0.080%), Kiowa (12.7%, a difference of 0.12%), Immigrants from Latin America (12.6%, a difference of 0.21%), Immigrants from Liberia (12.8%, a difference of 1.3%), and Immigrants from Bahamas (12.9%, a difference of 1.8%).
| Demographics | Rating | Rank | Unemployment Among Youth under 25 years |
| Immigrants | Latin America | 0.0 /100 | #266 | Tragic 12.6% |
| Sub-Saharan Africans | 0.0 /100 | #267 | Tragic 12.6% |
| Tlingit-Haida | 0.0 /100 | #268 | Tragic 12.7% |
| Kiowa | 0.0 /100 | #269 | Tragic 12.7% |
| Immigrants | Liberia | 0.0 /100 | #270 | Tragic 12.8% |
| Immigrants | Bahamas | 0.0 /100 | #271 | Tragic 12.9% |
| Cape Verdeans | 0.0 /100 | #272 | Tragic 12.9% |
| Nigerians | 0.0 /100 | #273 | Tragic 13.0% |
| Immigrants | Nigeria | 0.0 /100 | #274 | Tragic 13.0% |
| Bermudans | 0.0 /100 | #275 | Tragic 13.0% |
| Immigrants | Uzbekistan | 0.0 /100 | #276 | Tragic 13.1% |
| Bahamians | 0.0 /100 | #277 | Tragic 13.1% |
| Africans | 0.0 /100 | #278 | Tragic 13.2% |
| Cajuns | 0.0 /100 | #279 | Tragic 13.2% |
| Ute | 0.0 /100 | #280 | Tragic 13.3% |
| Armenians | 0.0 /100 | #281 | Tragic 13.3% |
| Sierra Leoneans | 0.0 /100 | #282 | Tragic 13.3% |
| Immigrants | Cameroon | 0.0 /100 | #283 | Tragic 13.3% |
| Lumbee | 0.0 /100 | #284 | Tragic 13.3% |
| Ghanaians | 0.0 /100 | #285 | Tragic 13.3% |
| Blackfeet | 0.0 /100 | #286 | Tragic 13.3% |