Lumbee vs Salvadoran Unemployment Among Women with Children Under 18 years
COMPARE
Lumbee
Salvadoran
Unemployment Among Women with Children Under 18 years
Unemployment Among Women with Children Under 18 years Comparison
Lumbee
Salvadorans
7.1%
UNEMPLOYMENT AMONG WOMEN WITH CHILDREN UNDER 18 YEARS
0.0/ 100
METRIC RATING
327th/ 347
METRIC RANK
6.2%
UNEMPLOYMENT AMONG WOMEN WITH CHILDREN UNDER 18 YEARS
0.0/ 100
METRIC RATING
272nd/ 347
METRIC RANK
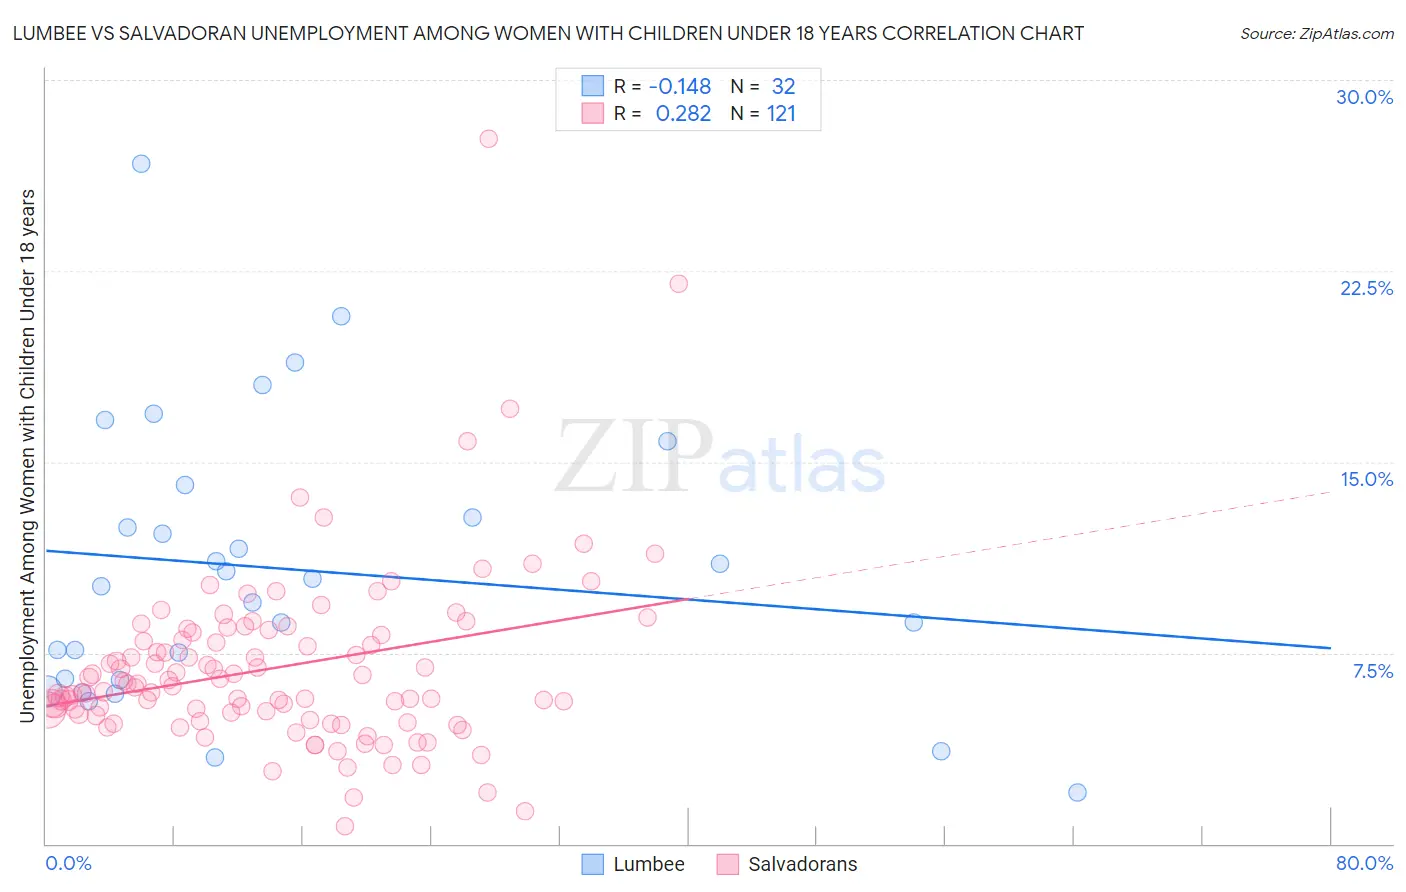
Lumbee vs Salvadoran Unemployment Among Women with Children Under 18 years Correlation Chart
The statistical analysis conducted on geographies consisting of 90,830,520 people shows a poor negative correlation between the proportion of Lumbee and unemployment rate among women with children under the age of 18 in the United States with a correlation coefficient (R) of -0.148 and weighted average of 7.1%. Similarly, the statistical analysis conducted on geographies consisting of 385,669,741 people shows a weak positive correlation between the proportion of Salvadorans and unemployment rate among women with children under the age of 18 in the United States with a correlation coefficient (R) of 0.282 and weighted average of 6.2%, a difference of 14.1%.
Unemployment Among Women with Children Under 18 years Correlation Summary
| Measurement | Lumbee | Salvadoran |
| Minimum | 2.0% | 0.70% |
| Maximum | 26.7% | 27.7% |
| Range | 24.7% | 27.0% |
| Mean | 10.8% | 6.9% |
| Median | 10.3% | 6.2% |
| Interquartile 25% (IQ1) | 6.5% | 5.1% |
| Interquartile 75% (IQ3) | 13.4% | 8.3% |
| Interquartile Range (IQR) | 7.0% | 3.2% |
| Standard Deviation (Sample) | 5.5% | 3.5% |
| Standard Deviation (Population) | 5.4% | 3.5% |
Similar Demographics by Unemployment Among Women with Children Under 18 years
Demographics Similar to Lumbee by Unemployment Among Women with Children Under 18 years
In terms of unemployment among women with children under 18 years, the demographic groups most similar to Lumbee are Chippewa (7.0%, a difference of 0.86%), Immigrants from Dominica (7.0%, a difference of 1.6%), Native/Alaskan (7.2%, a difference of 2.4%), Black/African American (7.3%, a difference of 2.8%), and Paiute (6.9%, a difference of 2.8%).
| Demographics | Rating | Rank | Unemployment Among Women with Children Under 18 years |
| Immigrants | Belize | 0.0 /100 | #320 | Tragic 6.7% |
| U.S. Virgin Islanders | 0.0 /100 | #321 | Tragic 6.7% |
| Houma | 0.0 /100 | #322 | Tragic 6.8% |
| Pueblo | 0.0 /100 | #323 | Tragic 6.8% |
| Paiute | 0.0 /100 | #324 | Tragic 6.9% |
| Immigrants | Dominica | 0.0 /100 | #325 | Tragic 7.0% |
| Chippewa | 0.0 /100 | #326 | Tragic 7.0% |
| Lumbee | 0.0 /100 | #327 | Tragic 7.1% |
| Natives/Alaskans | 0.0 /100 | #328 | Tragic 7.2% |
| Blacks/African Americans | 0.0 /100 | #329 | Tragic 7.3% |
| Colville | 0.0 /100 | #330 | Tragic 7.4% |
| Hopi | 0.0 /100 | #331 | Tragic 7.4% |
| Dominicans | 0.0 /100 | #332 | Tragic 7.5% |
| Immigrants | Dominican Republic | 0.0 /100 | #333 | Tragic 7.5% |
| Cheyenne | 0.0 /100 | #334 | Tragic 7.8% |
Demographics Similar to Salvadorans by Unemployment Among Women with Children Under 18 years
In terms of unemployment among women with children under 18 years, the demographic groups most similar to Salvadorans are Immigrants from Western Africa (6.2%, a difference of 0.090%), Senegalese (6.2%, a difference of 0.10%), Central American (6.2%, a difference of 0.22%), Dutch West Indian (6.2%, a difference of 0.28%), and Immigrants from Ghana (6.2%, a difference of 0.39%).
| Demographics | Rating | Rank | Unemployment Among Women with Children Under 18 years |
| Immigrants | Bahamas | 0.1 /100 | #265 | Tragic 6.1% |
| Sub-Saharan Africans | 0.1 /100 | #266 | Tragic 6.2% |
| French American Indians | 0.1 /100 | #267 | Tragic 6.2% |
| Trinidadians and Tobagonians | 0.1 /100 | #268 | Tragic 6.2% |
| Cajuns | 0.1 /100 | #269 | Tragic 6.2% |
| Ghanaians | 0.1 /100 | #270 | Tragic 6.2% |
| Central Americans | 0.0 /100 | #271 | Tragic 6.2% |
| Salvadorans | 0.0 /100 | #272 | Tragic 6.2% |
| Immigrants | Western Africa | 0.0 /100 | #273 | Tragic 6.2% |
| Senegalese | 0.0 /100 | #274 | Tragic 6.2% |
| Dutch West Indians | 0.0 /100 | #275 | Tragic 6.2% |
| Immigrants | Ghana | 0.0 /100 | #276 | Tragic 6.2% |
| Mexican American Indians | 0.0 /100 | #277 | Tragic 6.2% |
| Immigrants | Barbados | 0.0 /100 | #278 | Tragic 6.2% |
| Immigrants | Portugal | 0.0 /100 | #279 | Tragic 6.3% |