Lumbee vs Immigrants from Spain Unemployment Among Seniors over 75 years
COMPARE
Lumbee
Immigrants from Spain
Unemployment Among Seniors over 75 years
Unemployment Among Seniors over 75 years Comparison
Lumbee
Immigrants from Spain
13.5%
UNEMPLOYMENT AMONG SENIORS OVER 75 YEARS
0.0/ 100
METRIC RATING
341st/ 347
METRIC RANK
7.8%
UNEMPLOYMENT AMONG SENIORS OVER 75 YEARS
100.0/ 100
METRIC RATING
44th/ 347
METRIC RANK
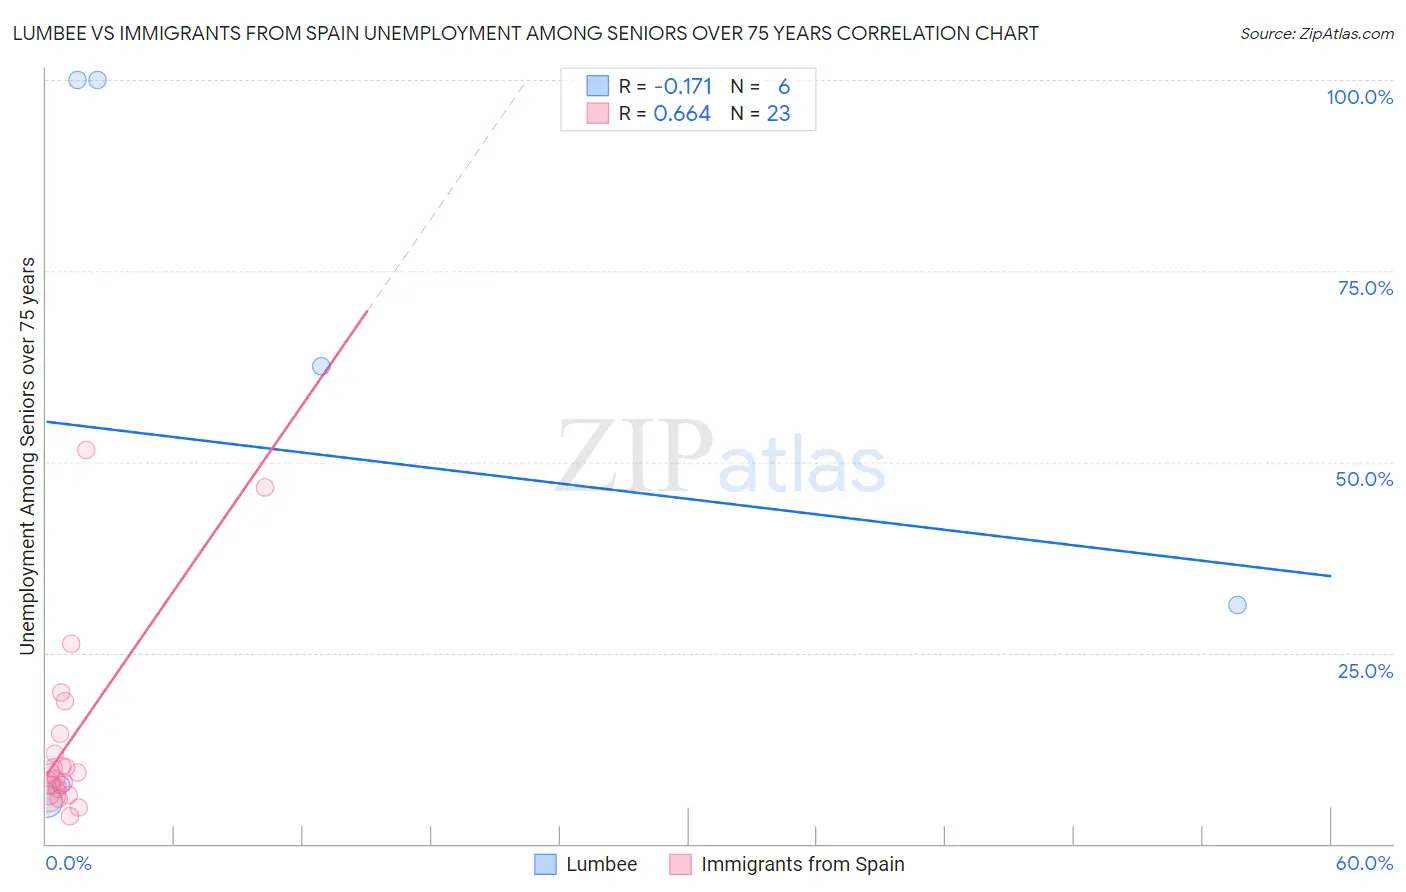
Lumbee vs Immigrants from Spain Unemployment Among Seniors over 75 years Correlation Chart
The statistical analysis conducted on geographies consisting of 65,452,608 people shows a poor negative correlation between the proportion of Lumbee and unemployment rate among seniors over the age of 75 in the United States with a correlation coefficient (R) of -0.171 and weighted average of 13.5%. Similarly, the statistical analysis conducted on geographies consisting of 145,232,971 people shows a significant positive correlation between the proportion of Immigrants from Spain and unemployment rate among seniors over the age of 75 in the United States with a correlation coefficient (R) of 0.664 and weighted average of 7.8%, a difference of 73.3%.
Unemployment Among Seniors over 75 years Correlation Summary
| Measurement | Lumbee | Immigrants from Spain |
| Minimum | 5.5% | 3.6% |
| Maximum | 100.0% | 51.6% |
| Range | 94.5% | 48.0% |
| Mean | 51.2% | 13.5% |
| Median | 46.9% | 9.3% |
| Interquartile 25% (IQ1) | 7.6% | 6.6% |
| Interquartile 75% (IQ3) | 100.0% | 14.4% |
| Interquartile Range (IQR) | 92.4% | 7.8% |
| Standard Deviation (Sample) | 43.1% | 12.4% |
| Standard Deviation (Population) | 39.3% | 12.1% |
Similar Demographics by Unemployment Among Seniors over 75 years
Demographics Similar to Lumbee by Unemployment Among Seniors over 75 years
In terms of unemployment among seniors over 75 years, the demographic groups most similar to Lumbee are Hmong (13.7%, a difference of 2.0%), Yup'ik (12.8%, a difference of 5.5%), Cajun (12.5%, a difference of 7.8%), Alaska Native (14.7%, a difference of 8.9%), and Immigrants from Cabo Verde (12.3%, a difference of 9.2%).
| Demographics | Rating | Rank | Unemployment Among Seniors over 75 years |
| Alaskan Athabascans | 0.0 /100 | #333 | Tragic 11.0% |
| Assyrians/Chaldeans/Syriacs | 0.0 /100 | #334 | Tragic 11.1% |
| French Canadians | 0.0 /100 | #335 | Tragic 11.2% |
| Immigrants | North Macedonia | 0.0 /100 | #336 | Tragic 11.3% |
| Cape Verdeans | 0.0 /100 | #337 | Tragic 11.4% |
| Immigrants | Cabo Verde | 0.0 /100 | #338 | Tragic 12.3% |
| Cajuns | 0.0 /100 | #339 | Tragic 12.5% |
| Yup'ik | 0.0 /100 | #340 | Tragic 12.8% |
| Lumbee | 0.0 /100 | #341 | Tragic 13.5% |
| Hmong | 0.0 /100 | #342 | Tragic 13.7% |
| Alaska Natives | 0.0 /100 | #343 | Tragic 14.7% |
| Immigrants | Yemen | 0.0 /100 | #344 | Tragic 16.5% |
| Yakama | 0.0 /100 | #345 | Tragic 18.4% |
| Tlingit-Haida | 0.0 /100 | #346 | Tragic 20.7% |
Demographics Similar to Immigrants from Spain by Unemployment Among Seniors over 75 years
In terms of unemployment among seniors over 75 years, the demographic groups most similar to Immigrants from Spain are British West Indian (7.8%, a difference of 0.010%), Immigrants from Denmark (7.8%, a difference of 0.040%), Immigrants from China (7.8%, a difference of 0.070%), Pueblo (7.7%, a difference of 0.33%), and Creek (7.8%, a difference of 0.48%).
| Demographics | Rating | Rank | Unemployment Among Seniors over 75 years |
| Immigrants | Hungary | 100.0 /100 | #37 | Exceptional 7.7% |
| Kiowa | 100.0 /100 | #38 | Exceptional 7.7% |
| Ugandans | 100.0 /100 | #39 | Exceptional 7.7% |
| Colville | 100.0 /100 | #40 | Exceptional 7.7% |
| Immigrants | Burma/Myanmar | 100.0 /100 | #41 | Exceptional 7.7% |
| Pueblo | 100.0 /100 | #42 | Exceptional 7.7% |
| Immigrants | Denmark | 100.0 /100 | #43 | Exceptional 7.8% |
| Immigrants | Spain | 100.0 /100 | #44 | Exceptional 7.8% |
| British West Indians | 100.0 /100 | #45 | Exceptional 7.8% |
| Immigrants | China | 100.0 /100 | #46 | Exceptional 7.8% |
| Creek | 100.0 /100 | #47 | Exceptional 7.8% |
| Immigrants | Chile | 100.0 /100 | #48 | Exceptional 7.8% |
| Potawatomi | 100.0 /100 | #49 | Exceptional 7.8% |
| Immigrants | Latvia | 100.0 /100 | #50 | Exceptional 7.8% |
| Moroccans | 100.0 /100 | #51 | Exceptional 7.8% |