Liberian vs Immigrants from Honduras Unemployment Among Ages 25 to 29 years
COMPARE
Liberian
Immigrants from Honduras
Unemployment Among Ages 25 to 29 years
Unemployment Among Ages 25 to 29 years Comparison
Liberians
Immigrants from Honduras
6.8%
UNEMPLOYMENT AMONG AGES 25 TO 29 YEARS
14.7/ 100
METRIC RATING
214th/ 347
METRIC RANK
7.0%
UNEMPLOYMENT AMONG AGES 25 TO 29 YEARS
2.4/ 100
METRIC RATING
233rd/ 347
METRIC RANK
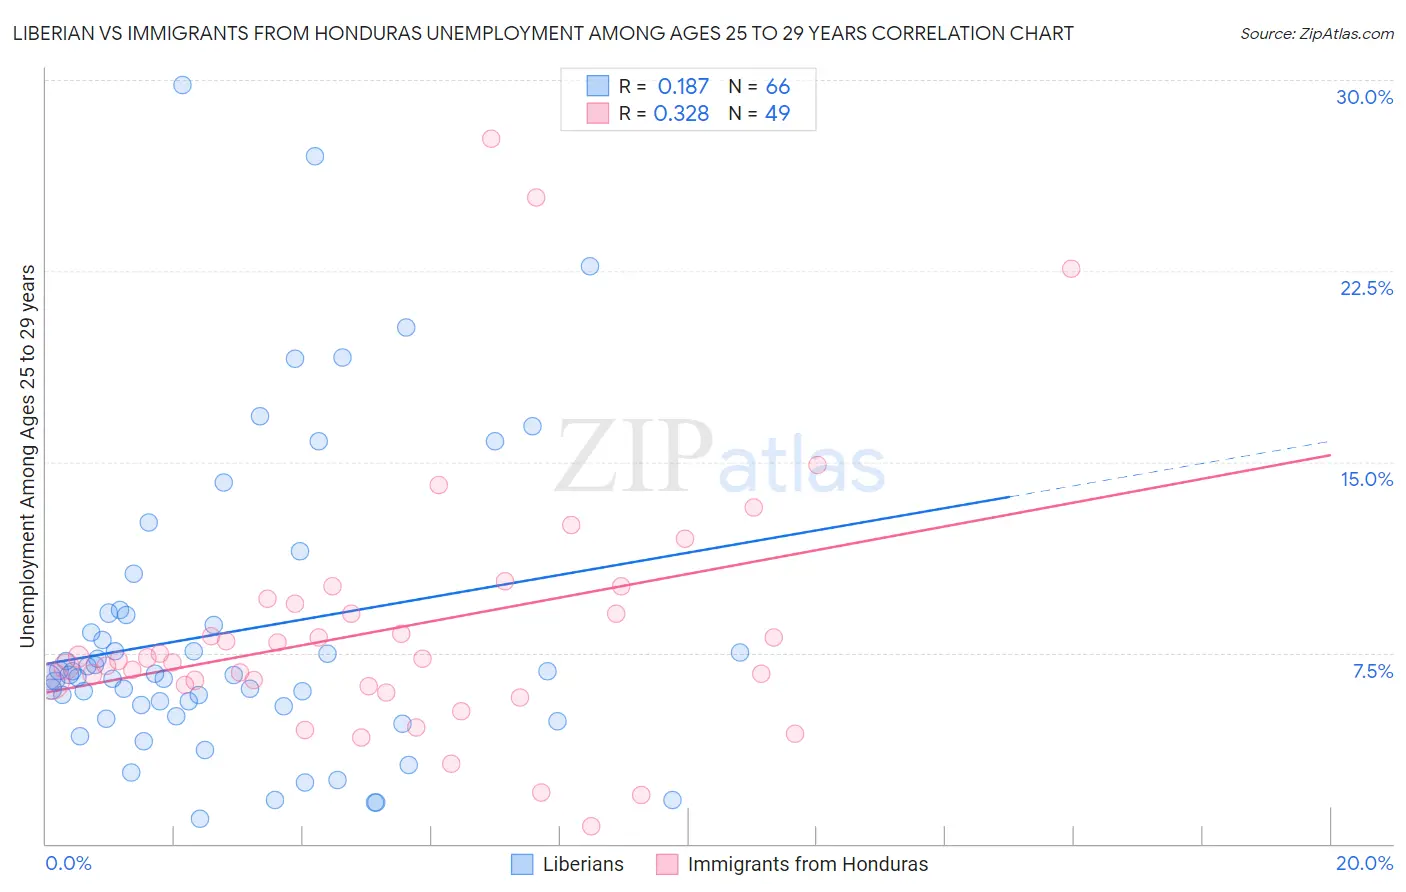
Liberian vs Immigrants from Honduras Unemployment Among Ages 25 to 29 years Correlation Chart
The statistical analysis conducted on geographies consisting of 116,808,426 people shows a poor positive correlation between the proportion of Liberians and unemployment rate among population between the ages 25 and 29 in the United States with a correlation coefficient (R) of 0.187 and weighted average of 6.8%. Similarly, the statistical analysis conducted on geographies consisting of 312,242,306 people shows a mild positive correlation between the proportion of Immigrants from Honduras and unemployment rate among population between the ages 25 and 29 in the United States with a correlation coefficient (R) of 0.328 and weighted average of 7.0%, a difference of 2.9%.
Unemployment Among Ages 25 to 29 years Correlation Summary
| Measurement | Liberian | Immigrants from Honduras |
| Minimum | 1.0% | 0.70% |
| Maximum | 29.8% | 27.7% |
| Range | 28.8% | 27.0% |
| Mean | 8.3% | 8.5% |
| Median | 6.6% | 7.3% |
| Interquartile 25% (IQ1) | 5.4% | 6.2% |
| Interquartile 75% (IQ3) | 9.0% | 9.5% |
| Interquartile Range (IQR) | 3.6% | 3.3% |
| Standard Deviation (Sample) | 5.9% | 5.2% |
| Standard Deviation (Population) | 5.9% | 5.2% |
Demographics Similar to Liberians and Immigrants from Honduras by Unemployment Among Ages 25 to 29 years
In terms of unemployment among ages 25 to 29 years, the demographic groups most similar to Liberians are Spanish (6.8%, a difference of 0.030%), Immigrants from Syria (6.8%, a difference of 0.050%), Slovak (6.8%, a difference of 0.050%), Ute (6.8%, a difference of 0.16%), and Immigrants from Austria (6.8%, a difference of 0.30%). Similarly, the demographic groups most similar to Immigrants from Honduras are Spanish American (7.0%, a difference of 0.19%), Central American (7.0%, a difference of 0.34%), Immigrants from El Salvador (7.0%, a difference of 0.63%), Bermudan (7.0%, a difference of 0.71%), and Immigrants from Panama (7.0%, a difference of 0.86%).
| Demographics | Rating | Rank | Unemployment Among Ages 25 to 29 years |
| Immigrants | Syria | 15.1 /100 | #213 | Poor 6.8% |
| Liberians | 14.7 /100 | #214 | Poor 6.8% |
| Spanish | 14.4 /100 | #215 | Poor 6.8% |
| Slovaks | 14.3 /100 | #216 | Poor 6.8% |
| Ute | 13.4 /100 | #217 | Poor 6.8% |
| Immigrants | Austria | 12.3 /100 | #218 | Poor 6.8% |
| Whites/Caucasians | 10.6 /100 | #219 | Poor 6.9% |
| French | 10.5 /100 | #220 | Poor 6.9% |
| Israelis | 9.8 /100 | #221 | Tragic 6.9% |
| Spaniards | 7.7 /100 | #222 | Tragic 6.9% |
| Celtics | 7.6 /100 | #223 | Tragic 6.9% |
| Immigrants | Immigrants | 6.2 /100 | #224 | Tragic 6.9% |
| Japanese | 5.4 /100 | #225 | Tragic 6.9% |
| Immigrants | Liberia | 4.8 /100 | #226 | Tragic 7.0% |
| Salvadorans | 4.4 /100 | #227 | Tragic 7.0% |
| Immigrants | Panama | 4.2 /100 | #228 | Tragic 7.0% |
| Bermudans | 3.8 /100 | #229 | Tragic 7.0% |
| Immigrants | El Salvador | 3.6 /100 | #230 | Tragic 7.0% |
| Central Americans | 3.0 /100 | #231 | Tragic 7.0% |
| Spanish Americans | 2.7 /100 | #232 | Tragic 7.0% |
| Immigrants | Honduras | 2.4 /100 | #233 | Tragic 7.0% |