Liberian vs Immigrants from Bolivia Unemployment Among Ages 55 to 59 years
COMPARE
Liberian
Immigrants from Bolivia
Unemployment Among Ages 55 to 59 years
Unemployment Among Ages 55 to 59 years Comparison
Liberians
Immigrants from Bolivia
5.1%
UNEMPLOYMENT AMONG AGES 55 TO 59 YEARS
0.9/ 100
METRIC RATING
242nd/ 347
METRIC RANK
4.2%
UNEMPLOYMENT AMONG AGES 55 TO 59 YEARS
100.0/ 100
METRIC RATING
5th/ 347
METRIC RANK
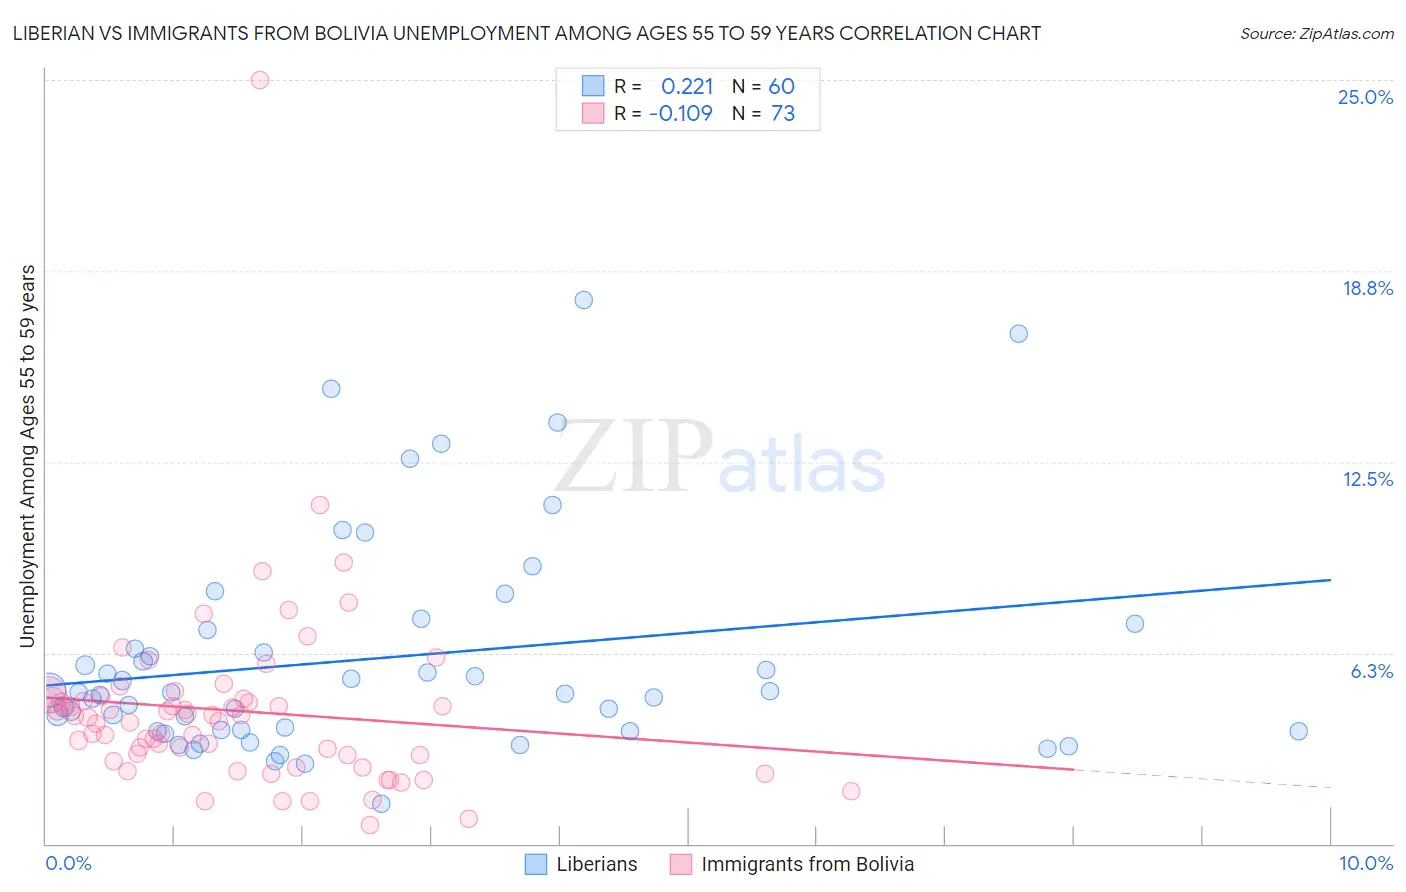
Liberian vs Immigrants from Bolivia Unemployment Among Ages 55 to 59 years Correlation Chart
The statistical analysis conducted on geographies consisting of 115,549,867 people shows a weak positive correlation between the proportion of Liberians and unemployment rate among population between the ages 55 and 59 in the United States with a correlation coefficient (R) of 0.221 and weighted average of 5.1%. Similarly, the statistical analysis conducted on geographies consisting of 154,662,666 people shows a poor negative correlation between the proportion of Immigrants from Bolivia and unemployment rate among population between the ages 55 and 59 in the United States with a correlation coefficient (R) of -0.109 and weighted average of 4.2%, a difference of 20.7%.
Unemployment Among Ages 55 to 59 years Correlation Summary
| Measurement | Liberian | Immigrants from Bolivia |
| Minimum | 1.3% | 0.60% |
| Maximum | 17.8% | 25.0% |
| Range | 16.5% | 24.4% |
| Mean | 6.1% | 4.4% |
| Median | 4.9% | 4.1% |
| Interquartile 25% (IQ1) | 3.7% | 2.8% |
| Interquartile 75% (IQ3) | 6.7% | 4.7% |
| Interquartile Range (IQR) | 3.0% | 1.9% |
| Standard Deviation (Sample) | 3.6% | 3.1% |
| Standard Deviation (Population) | 3.5% | 3.1% |
Similar Demographics by Unemployment Among Ages 55 to 59 years
Demographics Similar to Liberians by Unemployment Among Ages 55 to 59 years
In terms of unemployment among ages 55 to 59 years, the demographic groups most similar to Liberians are Brazilian (5.0%, a difference of 0.18%), Honduran (5.1%, a difference of 0.21%), Immigrants from Costa Rica (5.0%, a difference of 0.22%), Immigrants from Fiji (5.1%, a difference of 0.22%), and French American Indian (5.0%, a difference of 0.35%).
| Demographics | Rating | Rank | Unemployment Among Ages 55 to 59 years |
| Immigrants | Hong Kong | 1.4 /100 | #235 | Tragic 5.0% |
| Immigrants | Albania | 1.3 /100 | #236 | Tragic 5.0% |
| Choctaw | 1.3 /100 | #237 | Tragic 5.0% |
| Moroccans | 1.3 /100 | #238 | Tragic 5.0% |
| French American Indians | 1.2 /100 | #239 | Tragic 5.0% |
| Immigrants | Costa Rica | 1.1 /100 | #240 | Tragic 5.0% |
| Brazilians | 1.0 /100 | #241 | Tragic 5.0% |
| Liberians | 0.9 /100 | #242 | Tragic 5.1% |
| Hondurans | 0.7 /100 | #243 | Tragic 5.1% |
| Immigrants | Fiji | 0.7 /100 | #244 | Tragic 5.1% |
| Soviet Union | 0.6 /100 | #245 | Tragic 5.1% |
| Immigrants | Greece | 0.6 /100 | #246 | Tragic 5.1% |
| Immigrants | Honduras | 0.5 /100 | #247 | Tragic 5.1% |
| Native Hawaiians | 0.5 /100 | #248 | Tragic 5.1% |
| Comanche | 0.4 /100 | #249 | Tragic 5.1% |
Demographics Similar to Immigrants from Bolivia by Unemployment Among Ages 55 to 59 years
In terms of unemployment among ages 55 to 59 years, the demographic groups most similar to Immigrants from Bolivia are Venezuelan (4.2%, a difference of 0.54%), Norwegian (4.2%, a difference of 0.58%), Zimbabwean (4.2%, a difference of 1.1%), Bolivian (4.2%, a difference of 1.3%), and Cuban (4.2%, a difference of 1.4%).
| Demographics | Rating | Rank | Unemployment Among Ages 55 to 59 years |
| Fijians | 100.0 /100 | #1 | Exceptional 4.1% |
| Immigrants | Cuba | 100.0 /100 | #2 | Exceptional 4.1% |
| Immigrants | Venezuela | 100.0 /100 | #3 | Exceptional 4.1% |
| Venezuelans | 100.0 /100 | #4 | Exceptional 4.2% |
| Immigrants | Bolivia | 100.0 /100 | #5 | Exceptional 4.2% |
| Norwegians | 100.0 /100 | #6 | Exceptional 4.2% |
| Zimbabweans | 100.0 /100 | #7 | Exceptional 4.2% |
| Bolivians | 100.0 /100 | #8 | Exceptional 4.2% |
| Cubans | 100.0 /100 | #9 | Exceptional 4.2% |
| Tongans | 100.0 /100 | #10 | Exceptional 4.3% |
| Immigrants | Congo | 100.0 /100 | #11 | Exceptional 4.3% |
| Danes | 100.0 /100 | #12 | Exceptional 4.3% |
| Indonesians | 100.0 /100 | #13 | Exceptional 4.3% |
| Immigrants | India | 100.0 /100 | #14 | Exceptional 4.3% |
| Bulgarians | 100.0 /100 | #15 | Exceptional 4.3% |