Lebanese vs Crow Unemployment Among Ages 16 to 19 years
COMPARE
Lebanese
Crow
Unemployment Among Ages 16 to 19 years
Unemployment Among Ages 16 to 19 years Comparison
Lebanese
Crow
16.4%
UNEMPLOYMENT AMONG AGES 16 TO 19 YEARS
99.6/ 100
METRIC RATING
51st/ 347
METRIC RANK
26.2%
UNEMPLOYMENT AMONG AGES 16 TO 19 YEARS
0.0/ 100
METRIC RATING
340th/ 347
METRIC RANK
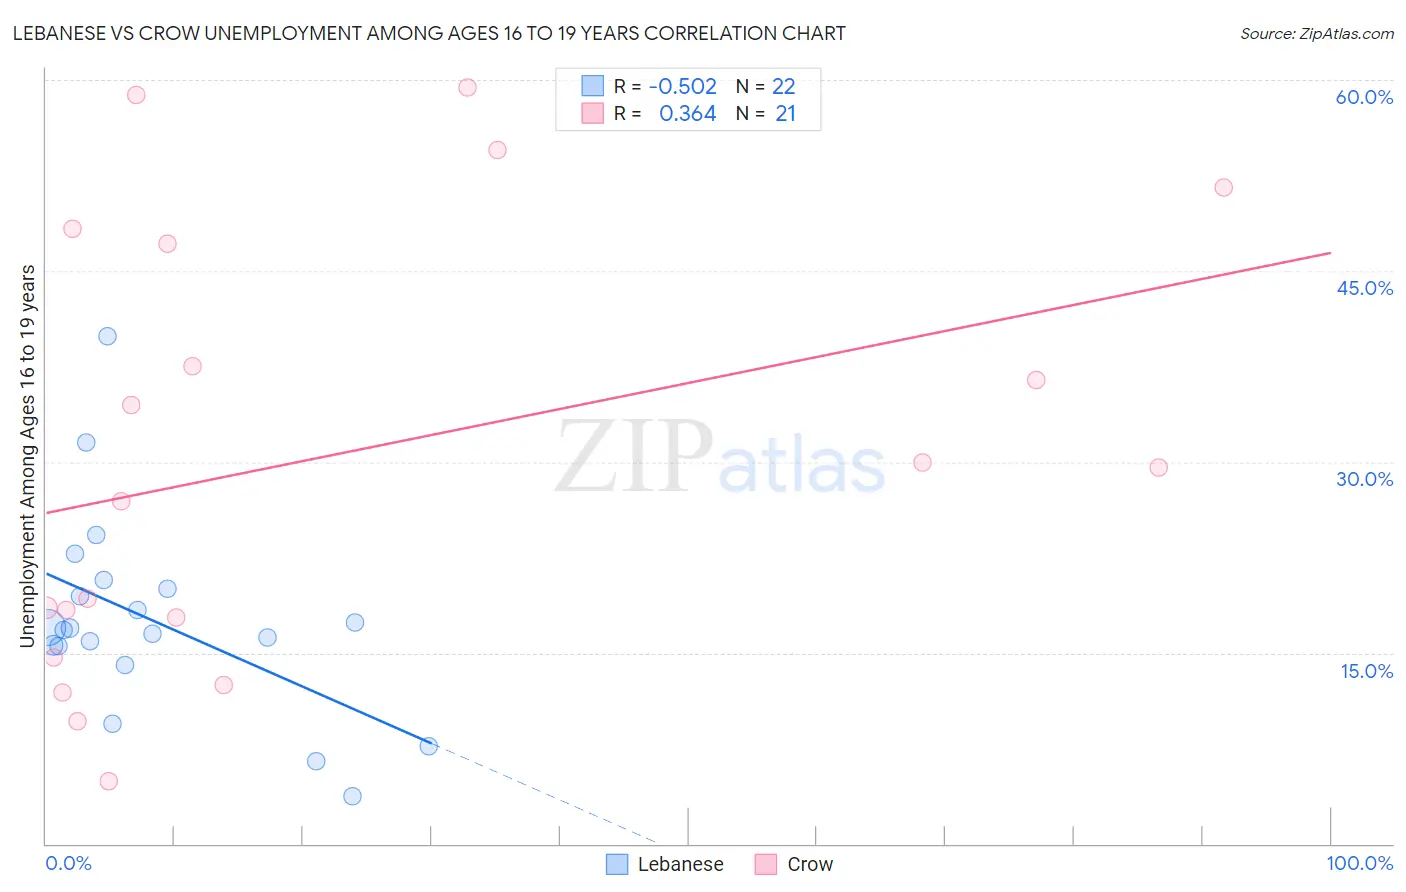
Lebanese vs Crow Unemployment Among Ages 16 to 19 years Correlation Chart
The statistical analysis conducted on geographies consisting of 379,959,035 people shows a substantial negative correlation between the proportion of Lebanese and unemployment rate among population between the ages 16 and 19 in the United States with a correlation coefficient (R) of -0.502 and weighted average of 16.4%. Similarly, the statistical analysis conducted on geographies consisting of 58,198,478 people shows a mild positive correlation between the proportion of Crow and unemployment rate among population between the ages 16 and 19 in the United States with a correlation coefficient (R) of 0.364 and weighted average of 26.2%, a difference of 59.7%.
Unemployment Among Ages 16 to 19 years Correlation Summary
| Measurement | Lebanese | Crow |
| Minimum | 3.7% | 4.9% |
| Maximum | 39.9% | 59.4% |
| Range | 36.2% | 54.5% |
| Mean | 17.6% | 30.6% |
| Median | 16.9% | 29.6% |
| Interquartile 25% (IQ1) | 15.5% | 16.2% |
| Interquartile 75% (IQ3) | 20.0% | 47.7% |
| Interquartile Range (IQR) | 4.5% | 31.5% |
| Standard Deviation (Sample) | 7.8% | 17.3% |
| Standard Deviation (Population) | 7.7% | 16.8% |
Similar Demographics by Unemployment Among Ages 16 to 19 years
Demographics Similar to Lebanese by Unemployment Among Ages 16 to 19 years
In terms of unemployment among ages 16 to 19 years, the demographic groups most similar to Lebanese are Welsh (16.4%, a difference of 0.030%), Bhutanese (16.4%, a difference of 0.10%), Slovene (16.4%, a difference of 0.12%), British (16.5%, a difference of 0.17%), and Czechoslovakian (16.5%, a difference of 0.19%).
| Demographics | Rating | Rank | Unemployment Among Ages 16 to 19 years |
| Immigrants | Zimbabwe | 99.7 /100 | #44 | Exceptional 16.3% |
| Poles | 99.7 /100 | #45 | Exceptional 16.4% |
| Immigrants | North Macedonia | 99.7 /100 | #46 | Exceptional 16.4% |
| Immigrants | Vietnam | 99.7 /100 | #47 | Exceptional 16.4% |
| Maltese | 99.7 /100 | #48 | Exceptional 16.4% |
| Iraqis | 99.7 /100 | #49 | Exceptional 16.4% |
| Bhutanese | 99.6 /100 | #50 | Exceptional 16.4% |
| Lebanese | 99.6 /100 | #51 | Exceptional 16.4% |
| Welsh | 99.6 /100 | #52 | Exceptional 16.4% |
| Slovenes | 99.6 /100 | #53 | Exceptional 16.4% |
| British | 99.5 /100 | #54 | Exceptional 16.5% |
| Czechoslovakians | 99.5 /100 | #55 | Exceptional 16.5% |
| Sri Lankans | 99.5 /100 | #56 | Exceptional 16.5% |
| Immigrants | Jordan | 99.4 /100 | #57 | Exceptional 16.5% |
| Immigrants | Uganda | 99.4 /100 | #58 | Exceptional 16.5% |
Demographics Similar to Crow by Unemployment Among Ages 16 to 19 years
In terms of unemployment among ages 16 to 19 years, the demographic groups most similar to Crow are Immigrants from Grenada (25.7%, a difference of 1.9%), Immigrants from St. Vincent and the Grenadines (25.7%, a difference of 2.1%), Immigrants from Guyana (25.5%, a difference of 2.9%), Kiowa (25.2%, a difference of 4.1%), and Arapaho (25.2%, a difference of 4.3%).
| Demographics | Rating | Rank | Unemployment Among Ages 16 to 19 years |
| Paiute | 0.0 /100 | #333 | Tragic 24.4% |
| Guyanese | 0.0 /100 | #334 | Tragic 24.8% |
| Arapaho | 0.0 /100 | #335 | Tragic 25.2% |
| Kiowa | 0.0 /100 | #336 | Tragic 25.2% |
| Immigrants | Guyana | 0.0 /100 | #337 | Tragic 25.5% |
| Immigrants | St. Vincent and the Grenadines | 0.0 /100 | #338 | Tragic 25.7% |
| Immigrants | Grenada | 0.0 /100 | #339 | Tragic 25.7% |
| Crow | 0.0 /100 | #340 | Tragic 26.2% |
| Puerto Ricans | 0.0 /100 | #341 | Tragic 27.5% |
| Inupiat | 0.0 /100 | #342 | Tragic 28.1% |
| Navajo | 0.0 /100 | #343 | Tragic 29.0% |
| Colville | 0.0 /100 | #344 | Tragic 29.7% |
| Hopi | 0.0 /100 | #345 | Tragic 30.7% |
| Yuman | 0.0 /100 | #346 | Tragic 37.4% |
| Yup'ik | 0.0 /100 | #347 | Tragic 41.0% |