Latvian vs Immigrants from Zimbabwe Unemployment Among Women with Children Under 18 years
COMPARE
Latvian
Immigrants from Zimbabwe
Unemployment Among Women with Children Under 18 years
Unemployment Among Women with Children Under 18 years Comparison
Latvians
Immigrants from Zimbabwe
4.9%
UNEMPLOYMENT AMONG WOMEN WITH CHILDREN UNDER 18 YEARS
99.7/ 100
METRIC RATING
20th/ 347
METRIC RANK
5.2%
UNEMPLOYMENT AMONG WOMEN WITH CHILDREN UNDER 18 YEARS
93.6/ 100
METRIC RATING
91st/ 347
METRIC RANK
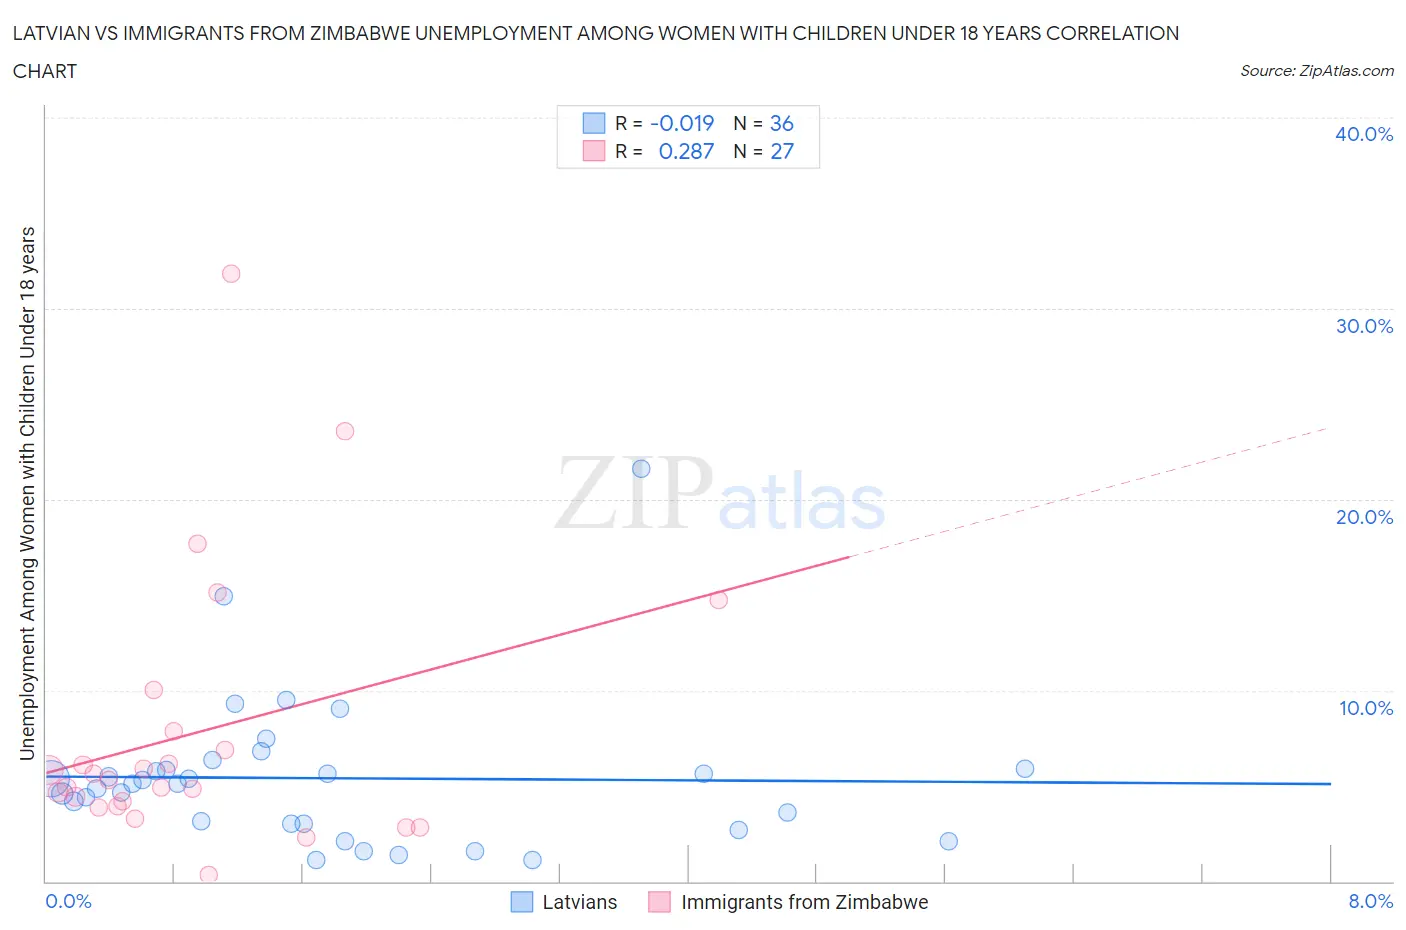
Latvian vs Immigrants from Zimbabwe Unemployment Among Women with Children Under 18 years Correlation Chart
The statistical analysis conducted on geographies consisting of 214,415,108 people shows no correlation between the proportion of Latvians and unemployment rate among women with children under the age of 18 in the United States with a correlation coefficient (R) of -0.019 and weighted average of 4.9%. Similarly, the statistical analysis conducted on geographies consisting of 116,172,432 people shows a weak positive correlation between the proportion of Immigrants from Zimbabwe and unemployment rate among women with children under the age of 18 in the United States with a correlation coefficient (R) of 0.287 and weighted average of 5.2%, a difference of 6.5%.
Unemployment Among Women with Children Under 18 years Correlation Summary
| Measurement | Latvian | Immigrants from Zimbabwe |
| Minimum | 1.1% | 0.30% |
| Maximum | 21.6% | 31.8% |
| Range | 20.5% | 31.5% |
| Mean | 5.4% | 7.8% |
| Median | 5.1% | 5.3% |
| Interquartile 25% (IQ1) | 3.0% | 3.9% |
| Interquartile 75% (IQ3) | 5.9% | 7.9% |
| Interquartile Range (IQR) | 2.9% | 4.0% |
| Standard Deviation (Sample) | 3.9% | 7.1% |
| Standard Deviation (Population) | 3.9% | 6.9% |
Similar Demographics by Unemployment Among Women with Children Under 18 years
Demographics Similar to Latvians by Unemployment Among Women with Children Under 18 years
In terms of unemployment among women with children under 18 years, the demographic groups most similar to Latvians are German (4.9%, a difference of 0.12%), Slovene (4.9%, a difference of 0.28%), Immigrants from Singapore (4.9%, a difference of 0.38%), Taiwanese (4.8%, a difference of 0.58%), and European (4.9%, a difference of 0.61%).
| Demographics | Rating | Rank | Unemployment Among Women with Children Under 18 years |
| Bulgarians | 99.9 /100 | #13 | Exceptional 4.8% |
| Cambodians | 99.9 /100 | #14 | Exceptional 4.8% |
| Thais | 99.8 /100 | #15 | Exceptional 4.8% |
| Taiwanese | 99.8 /100 | #16 | Exceptional 4.8% |
| Immigrants | Singapore | 99.8 /100 | #17 | Exceptional 4.9% |
| Slovenes | 99.8 /100 | #18 | Exceptional 4.9% |
| Germans | 99.8 /100 | #19 | Exceptional 4.9% |
| Latvians | 99.7 /100 | #20 | Exceptional 4.9% |
| Europeans | 99.6 /100 | #21 | Exceptional 4.9% |
| Indians (Asian) | 99.6 /100 | #22 | Exceptional 4.9% |
| Immigrants | China | 99.6 /100 | #23 | Exceptional 4.9% |
| Belgians | 99.5 /100 | #24 | Exceptional 4.9% |
| Chinese | 99.5 /100 | #25 | Exceptional 4.9% |
| Swiss | 99.5 /100 | #26 | Exceptional 4.9% |
| Soviet Union | 99.5 /100 | #27 | Exceptional 4.9% |
Demographics Similar to Immigrants from Zimbabwe by Unemployment Among Women with Children Under 18 years
In terms of unemployment among women with children under 18 years, the demographic groups most similar to Immigrants from Zimbabwe are Ukrainian (5.2%, a difference of 0.070%), Immigrants from Pakistan (5.2%, a difference of 0.080%), Immigrants from Canada (5.2%, a difference of 0.10%), Immigrants from Turkey (5.2%, a difference of 0.21%), and Immigrants from Kuwait (5.2%, a difference of 0.29%).
| Demographics | Rating | Rank | Unemployment Among Women with Children Under 18 years |
| Australians | 95.1 /100 | #84 | Exceptional 5.2% |
| Paraguayans | 94.8 /100 | #85 | Exceptional 5.2% |
| Immigrants | Indonesia | 94.8 /100 | #86 | Exceptional 5.2% |
| Laotians | 94.7 /100 | #87 | Exceptional 5.2% |
| Immigrants | Scotland | 94.5 /100 | #88 | Exceptional 5.2% |
| Immigrants | Turkey | 94.2 /100 | #89 | Exceptional 5.2% |
| Ukrainians | 93.8 /100 | #90 | Exceptional 5.2% |
| Immigrants | Zimbabwe | 93.6 /100 | #91 | Exceptional 5.2% |
| Immigrants | Pakistan | 93.3 /100 | #92 | Exceptional 5.2% |
| Immigrants | Canada | 93.3 /100 | #93 | Exceptional 5.2% |
| Immigrants | Kuwait | 92.6 /100 | #94 | Exceptional 5.2% |
| Immigrants | North America | 92.3 /100 | #95 | Exceptional 5.2% |
| Immigrants | Albania | 92.2 /100 | #96 | Exceptional 5.2% |
| Palestinians | 92.2 /100 | #97 | Exceptional 5.2% |
| Immigrants | Vietnam | 92.0 /100 | #98 | Exceptional 5.2% |