Laotian vs Immigrants from Japan Unemployment Among Women with Children Under 18 years
COMPARE
Laotian
Immigrants from Japan
Unemployment Among Women with Children Under 18 years
Unemployment Among Women with Children Under 18 years Comparison
Laotians
Immigrants from Japan
5.2%
UNEMPLOYMENT AMONG WOMEN WITH CHILDREN UNDER 18 YEARS
94.7/ 100
METRIC RATING
87th/ 347
METRIC RANK
5.0%
UNEMPLOYMENT AMONG WOMEN WITH CHILDREN UNDER 18 YEARS
98.4/ 100
METRIC RATING
50th/ 347
METRIC RANK
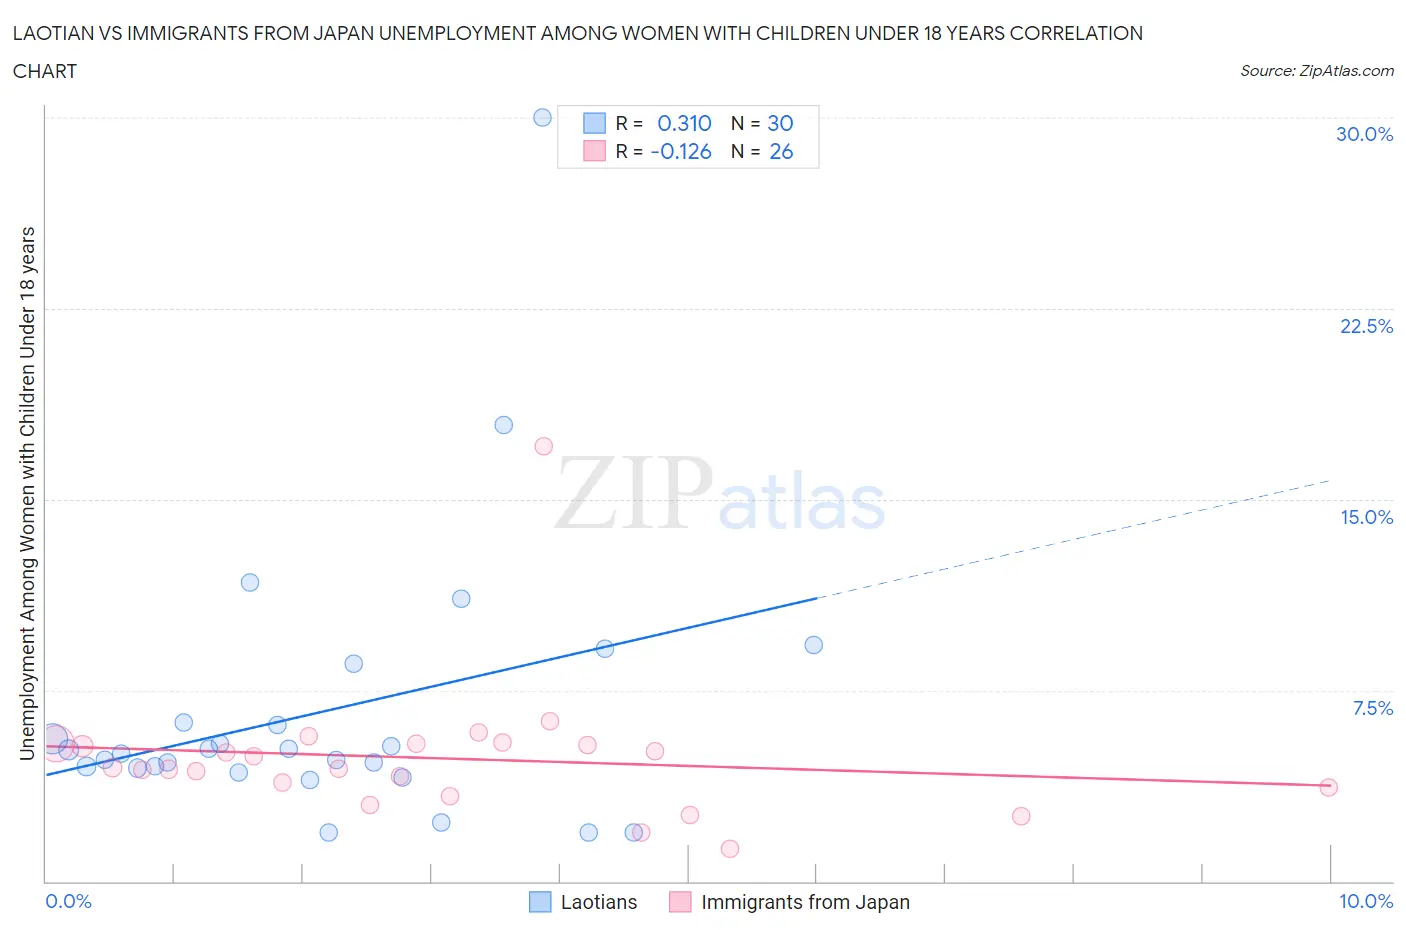
Laotian vs Immigrants from Japan Unemployment Among Women with Children Under 18 years Correlation Chart
The statistical analysis conducted on geographies consisting of 220,294,555 people shows a mild positive correlation between the proportion of Laotians and unemployment rate among women with children under the age of 18 in the United States with a correlation coefficient (R) of 0.310 and weighted average of 5.2%. Similarly, the statistical analysis conducted on geographies consisting of 329,595,310 people shows a poor negative correlation between the proportion of Immigrants from Japan and unemployment rate among women with children under the age of 18 in the United States with a correlation coefficient (R) of -0.126 and weighted average of 5.0%, a difference of 2.3%.
Unemployment Among Women with Children Under 18 years Correlation Summary
| Measurement | Laotian | Immigrants from Japan |
| Minimum | 1.9% | 1.3% |
| Maximum | 30.0% | 17.1% |
| Range | 28.1% | 15.8% |
| Mean | 6.7% | 4.8% |
| Median | 5.1% | 4.4% |
| Interquartile 25% (IQ1) | 4.4% | 3.7% |
| Interquartile 75% (IQ3) | 6.2% | 5.4% |
| Interquartile Range (IQR) | 1.8% | 1.7% |
| Standard Deviation (Sample) | 5.5% | 2.8% |
| Standard Deviation (Population) | 5.4% | 2.7% |
Similar Demographics by Unemployment Among Women with Children Under 18 years
Demographics Similar to Laotians by Unemployment Among Women with Children Under 18 years
In terms of unemployment among women with children under 18 years, the demographic groups most similar to Laotians are Immigrants from Indonesia (5.2%, a difference of 0.030%), Paraguayan (5.2%, a difference of 0.040%), Immigrants from Scotland (5.2%, a difference of 0.070%), Australian (5.2%, a difference of 0.15%), and Maltese (5.2%, a difference of 0.16%).
| Demographics | Rating | Rank | Unemployment Among Women with Children Under 18 years |
| Bolivians | 95.5 /100 | #80 | Exceptional 5.1% |
| Immigrants | Lithuania | 95.4 /100 | #81 | Exceptional 5.2% |
| Romanians | 95.3 /100 | #82 | Exceptional 5.2% |
| Maltese | 95.1 /100 | #83 | Exceptional 5.2% |
| Australians | 95.1 /100 | #84 | Exceptional 5.2% |
| Paraguayans | 94.8 /100 | #85 | Exceptional 5.2% |
| Immigrants | Indonesia | 94.8 /100 | #86 | Exceptional 5.2% |
| Laotians | 94.7 /100 | #87 | Exceptional 5.2% |
| Immigrants | Scotland | 94.5 /100 | #88 | Exceptional 5.2% |
| Immigrants | Turkey | 94.2 /100 | #89 | Exceptional 5.2% |
| Ukrainians | 93.8 /100 | #90 | Exceptional 5.2% |
| Immigrants | Zimbabwe | 93.6 /100 | #91 | Exceptional 5.2% |
| Immigrants | Pakistan | 93.3 /100 | #92 | Exceptional 5.2% |
| Immigrants | Canada | 93.3 /100 | #93 | Exceptional 5.2% |
| Immigrants | Kuwait | 92.6 /100 | #94 | Exceptional 5.2% |
Demographics Similar to Immigrants from Japan by Unemployment Among Women with Children Under 18 years
In terms of unemployment among women with children under 18 years, the demographic groups most similar to Immigrants from Japan are Lithuanian (5.0%, a difference of 0.030%), Yugoslavian (5.1%, a difference of 0.080%), Immigrants from Nepal (5.1%, a difference of 0.080%), Scottish (5.1%, a difference of 0.17%), and Immigrants from Serbia (5.1%, a difference of 0.20%).
| Demographics | Rating | Rank | Unemployment Among Women with Children Under 18 years |
| Turks | 98.9 /100 | #43 | Exceptional 5.0% |
| Immigrants | Moldova | 98.9 /100 | #44 | Exceptional 5.0% |
| Immigrants | Malaysia | 98.8 /100 | #45 | Exceptional 5.0% |
| Immigrants | Korea | 98.7 /100 | #46 | Exceptional 5.0% |
| British | 98.7 /100 | #47 | Exceptional 5.0% |
| Northern Europeans | 98.6 /100 | #48 | Exceptional 5.0% |
| Lithuanians | 98.4 /100 | #49 | Exceptional 5.0% |
| Immigrants | Japan | 98.4 /100 | #50 | Exceptional 5.0% |
| Yugoslavians | 98.3 /100 | #51 | Exceptional 5.1% |
| Immigrants | Nepal | 98.3 /100 | #52 | Exceptional 5.1% |
| Scottish | 98.2 /100 | #53 | Exceptional 5.1% |
| Immigrants | Serbia | 98.2 /100 | #54 | Exceptional 5.1% |
| Immigrants | Sri Lanka | 98.1 /100 | #55 | Exceptional 5.1% |
| Immigrants | Ireland | 98.0 /100 | #56 | Exceptional 5.1% |
| Czechoslovakians | 98.0 /100 | #57 | Exceptional 5.1% |