Korean vs Slovak Unemployment Among Women with Children Under 18 years
COMPARE
Korean
Slovak
Unemployment Among Women with Children Under 18 years
Unemployment Among Women with Children Under 18 years Comparison
Koreans
Slovaks
5.4%
UNEMPLOYMENT AMONG WOMEN WITH CHILDREN UNDER 18 YEARS
70.5/ 100
METRIC RATING
155th/ 347
METRIC RANK
5.3%
UNEMPLOYMENT AMONG WOMEN WITH CHILDREN UNDER 18 YEARS
80.5/ 100
METRIC RATING
134th/ 347
METRIC RANK
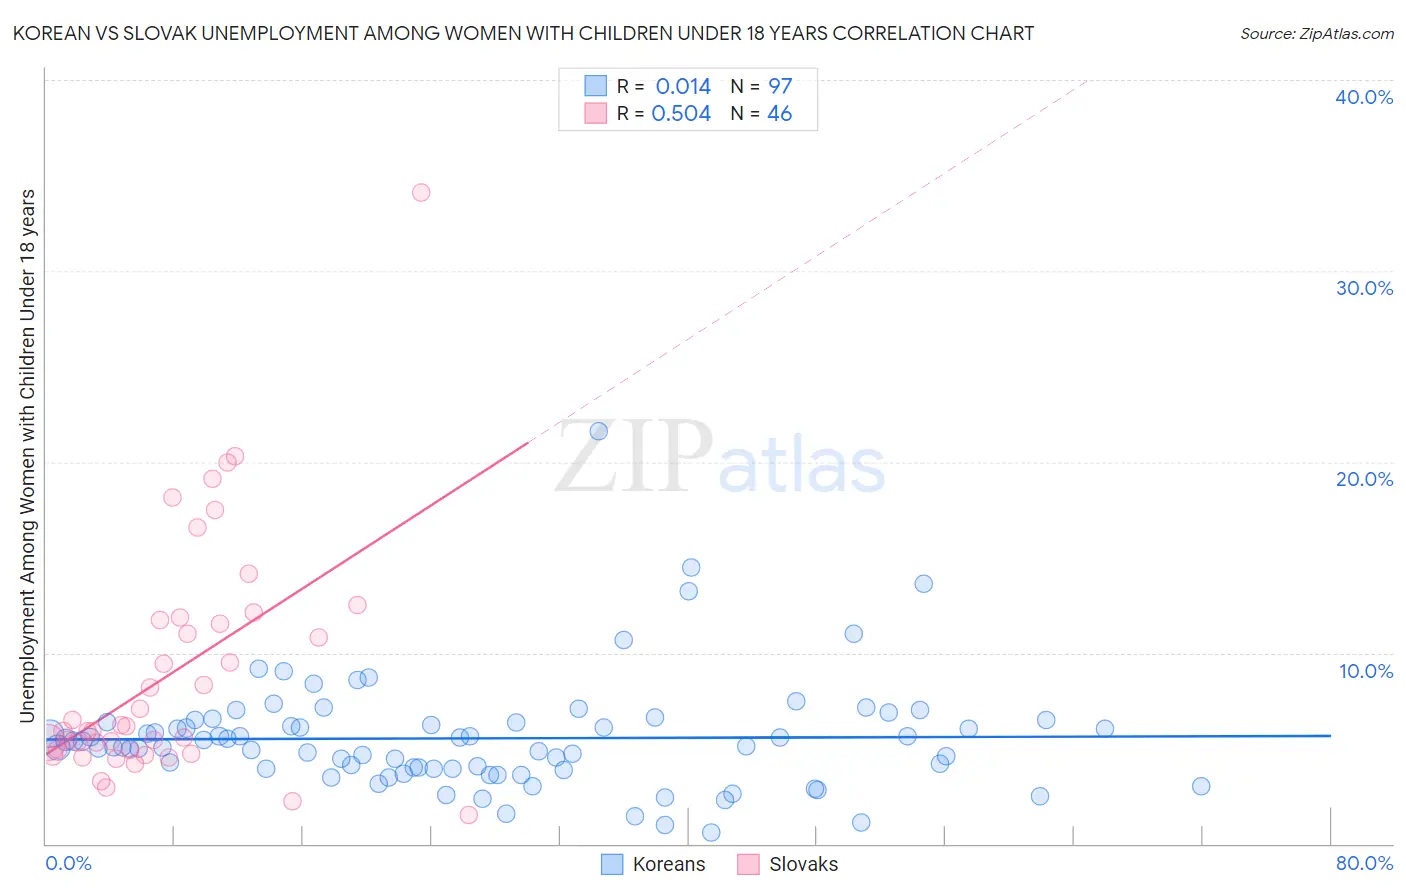
Korean vs Slovak Unemployment Among Women with Children Under 18 years Correlation Chart
The statistical analysis conducted on geographies consisting of 479,580,464 people shows no correlation between the proportion of Koreans and unemployment rate among women with children under the age of 18 in the United States with a correlation coefficient (R) of 0.014 and weighted average of 5.4%. Similarly, the statistical analysis conducted on geographies consisting of 376,334,791 people shows a substantial positive correlation between the proportion of Slovaks and unemployment rate among women with children under the age of 18 in the United States with a correlation coefficient (R) of 0.504 and weighted average of 5.3%, a difference of 0.99%.
Unemployment Among Women with Children Under 18 years Correlation Summary
| Measurement | Korean | Slovak |
| Minimum | 0.60% | 1.5% |
| Maximum | 21.6% | 34.1% |
| Range | 21.0% | 32.6% |
| Mean | 5.5% | 8.9% |
| Median | 5.1% | 6.0% |
| Interquartile 25% (IQ1) | 3.9% | 4.9% |
| Interquartile 75% (IQ3) | 6.3% | 11.7% |
| Interquartile Range (IQR) | 2.4% | 6.8% |
| Standard Deviation (Sample) | 3.0% | 6.3% |
| Standard Deviation (Population) | 2.9% | 6.2% |
Similar Demographics by Unemployment Among Women with Children Under 18 years
Demographics Similar to Koreans by Unemployment Among Women with Children Under 18 years
In terms of unemployment among women with children under 18 years, the demographic groups most similar to Koreans are Immigrants from Latvia (5.4%, a difference of 0.020%), South African (5.4%, a difference of 0.020%), Carpatho Rusyn (5.4%, a difference of 0.030%), German Russian (5.4%, a difference of 0.030%), and Immigrants from Iran (5.4%, a difference of 0.050%).
| Demographics | Rating | Rank | Unemployment Among Women with Children Under 18 years |
| Immigrants | Western Europe | 72.8 /100 | #148 | Good 5.4% |
| Immigrants | Kenya | 72.2 /100 | #149 | Good 5.4% |
| Immigrants | Argentina | 71.7 /100 | #150 | Good 5.4% |
| Immigrants | Iran | 71.1 /100 | #151 | Good 5.4% |
| Immigrants | South Eastern Asia | 71.1 /100 | #152 | Good 5.4% |
| Carpatho Rusyns | 70.8 /100 | #153 | Good 5.4% |
| Immigrants | Latvia | 70.8 /100 | #154 | Good 5.4% |
| Koreans | 70.5 /100 | #155 | Good 5.4% |
| South Africans | 70.3 /100 | #156 | Good 5.4% |
| German Russians | 70.2 /100 | #157 | Good 5.4% |
| Immigrants | Burma/Myanmar | 69.5 /100 | #158 | Good 5.4% |
| Chickasaw | 68.4 /100 | #159 | Good 5.4% |
| Afghans | 66.6 /100 | #160 | Good 5.4% |
| Immigrants | Iraq | 65.9 /100 | #161 | Good 5.4% |
| Immigrants | Saudi Arabia | 65.0 /100 | #162 | Good 5.4% |
Demographics Similar to Slovaks by Unemployment Among Women with Children Under 18 years
In terms of unemployment among women with children under 18 years, the demographic groups most similar to Slovaks are Ethiopian (5.3%, a difference of 0.020%), New Zealander (5.3%, a difference of 0.070%), Immigrants from Ethiopia (5.3%, a difference of 0.11%), Immigrants from Jordan (5.3%, a difference of 0.12%), and Immigrants from Israel (5.3%, a difference of 0.17%).
| Demographics | Rating | Rank | Unemployment Among Women with Children Under 18 years |
| Whites/Caucasians | 82.9 /100 | #127 | Excellent 5.3% |
| Immigrants | South Africa | 82.8 /100 | #128 | Excellent 5.3% |
| Immigrants | Italy | 82.3 /100 | #129 | Excellent 5.3% |
| Immigrants | Austria | 82.1 /100 | #130 | Excellent 5.3% |
| Immigrants | Israel | 81.9 /100 | #131 | Excellent 5.3% |
| Immigrants | Ethiopia | 81.4 /100 | #132 | Excellent 5.3% |
| Ethiopians | 80.7 /100 | #133 | Excellent 5.3% |
| Slovaks | 80.5 /100 | #134 | Excellent 5.3% |
| New Zealanders | 79.9 /100 | #135 | Good 5.3% |
| Immigrants | Jordan | 79.5 /100 | #136 | Good 5.3% |
| Jordanians | 78.8 /100 | #137 | Good 5.3% |
| Argentineans | 78.8 /100 | #138 | Good 5.3% |
| Immigrants | Ukraine | 78.5 /100 | #139 | Good 5.3% |
| Immigrants | Norway | 76.2 /100 | #140 | Good 5.3% |
| Venezuelans | 76.0 /100 | #141 | Good 5.3% |