Korean vs Immigrants from Zimbabwe Unemployment Among Ages 30 to 34 years
COMPARE
Korean
Immigrants from Zimbabwe
Unemployment Among Ages 30 to 34 years
Unemployment Among Ages 30 to 34 years Comparison
Koreans
Immigrants from Zimbabwe
5.6%
UNEMPLOYMENT AMONG AGES 30 TO 34 YEARS
20.7/ 100
METRIC RATING
203rd/ 347
METRIC RANK
5.1%
UNEMPLOYMENT AMONG AGES 30 TO 34 YEARS
96.7/ 100
METRIC RATING
66th/ 347
METRIC RANK
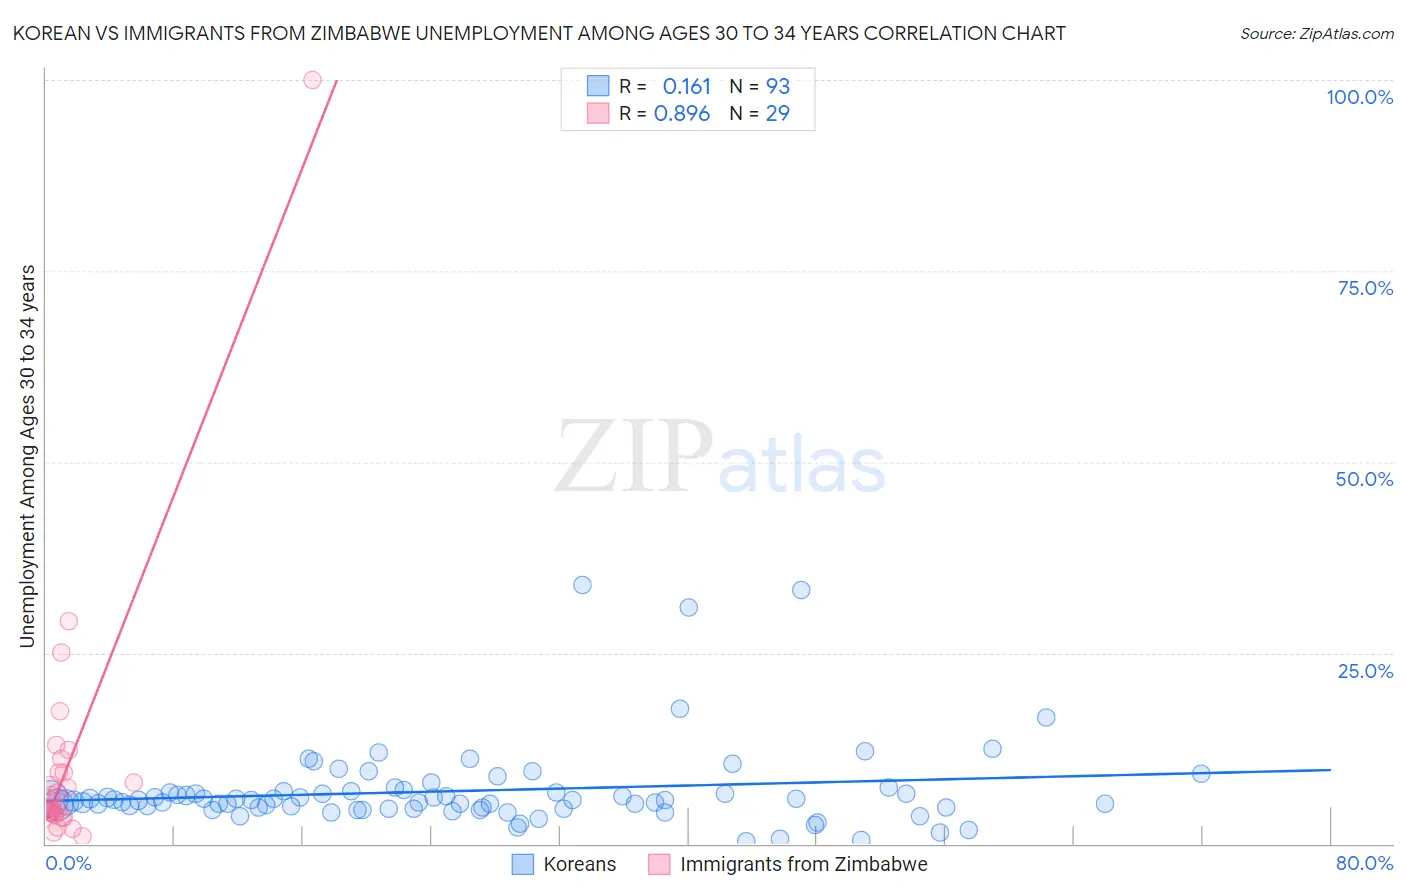
Korean vs Immigrants from Zimbabwe Unemployment Among Ages 30 to 34 years Correlation Chart
The statistical analysis conducted on geographies consisting of 466,228,807 people shows a poor positive correlation between the proportion of Koreans and unemployment rate among population between the ages 30 and 34 in the United States with a correlation coefficient (R) of 0.161 and weighted average of 5.6%. Similarly, the statistical analysis conducted on geographies consisting of 115,837,082 people shows a very strong positive correlation between the proportion of Immigrants from Zimbabwe and unemployment rate among population between the ages 30 and 34 in the United States with a correlation coefficient (R) of 0.896 and weighted average of 5.1%, a difference of 8.7%.
Unemployment Among Ages 30 to 34 years Correlation Summary
| Measurement | Korean | Immigrants from Zimbabwe |
| Minimum | 0.40% | 1.0% |
| Maximum | 33.8% | 100.0% |
| Range | 33.4% | 99.0% |
| Mean | 6.9% | 10.9% |
| Median | 5.8% | 5.3% |
| Interquartile 25% (IQ1) | 4.6% | 3.9% |
| Interquartile 75% (IQ3) | 6.8% | 10.2% |
| Interquartile Range (IQR) | 2.2% | 6.3% |
| Standard Deviation (Sample) | 5.6% | 18.3% |
| Standard Deviation (Population) | 5.5% | 18.0% |
Similar Demographics by Unemployment Among Ages 30 to 34 years
Demographics Similar to Koreans by Unemployment Among Ages 30 to 34 years
In terms of unemployment among ages 30 to 34 years, the demographic groups most similar to Koreans are Immigrants from Germany (5.6%, a difference of 0.22%), Immigrants from Cameroon (5.6%, a difference of 0.25%), South American Indian (5.6%, a difference of 0.36%), Immigrants from Southern Europe (5.6%, a difference of 0.49%), and Nicaraguan (5.6%, a difference of 0.56%).
| Demographics | Rating | Rank | Unemployment Among Ages 30 to 34 years |
| Immigrants | South America | 29.8 /100 | #196 | Fair 5.5% |
| Immigrants | Nicaragua | 28.9 /100 | #197 | Fair 5.5% |
| Immigrants | Afghanistan | 27.2 /100 | #198 | Fair 5.6% |
| Nicaraguans | 26.6 /100 | #199 | Fair 5.6% |
| Immigrants | Southern Europe | 25.8 /100 | #200 | Fair 5.6% |
| South American Indians | 24.4 /100 | #201 | Fair 5.6% |
| Immigrants | Germany | 22.9 /100 | #202 | Fair 5.6% |
| Koreans | 20.7 /100 | #203 | Fair 5.6% |
| Immigrants | Cameroon | 18.4 /100 | #204 | Poor 5.6% |
| Immigrants | Costa Rica | 14.4 /100 | #205 | Poor 5.6% |
| Alsatians | 14.3 /100 | #206 | Poor 5.6% |
| Israelis | 12.8 /100 | #207 | Poor 5.6% |
| Immigrants | Philippines | 11.5 /100 | #208 | Poor 5.7% |
| French | 10.8 /100 | #209 | Poor 5.7% |
| Whites/Caucasians | 9.2 /100 | #210 | Tragic 5.7% |
Demographics Similar to Immigrants from Zimbabwe by Unemployment Among Ages 30 to 34 years
In terms of unemployment among ages 30 to 34 years, the demographic groups most similar to Immigrants from Zimbabwe are Immigrants from Japan (5.1%, a difference of 0.070%), Burmese (5.1%, a difference of 0.13%), Immigrants from Eastern Asia (5.1%, a difference of 0.14%), Jordanian (5.1%, a difference of 0.14%), and Immigrants from Northern Africa (5.1%, a difference of 0.15%).
| Demographics | Rating | Rank | Unemployment Among Ages 30 to 34 years |
| Swedes | 97.1 /100 | #59 | Exceptional 5.1% |
| Immigrants | Somalia | 97.1 /100 | #60 | Exceptional 5.1% |
| Indians (Asian) | 97.0 /100 | #61 | Exceptional 5.1% |
| Immigrants | France | 97.0 /100 | #62 | Exceptional 5.1% |
| Belgians | 97.0 /100 | #63 | Exceptional 5.1% |
| Immigrants | Eastern Asia | 96.9 /100 | #64 | Exceptional 5.1% |
| Immigrants | Japan | 96.8 /100 | #65 | Exceptional 5.1% |
| Immigrants | Zimbabwe | 96.7 /100 | #66 | Exceptional 5.1% |
| Burmese | 96.5 /100 | #67 | Exceptional 5.1% |
| Jordanians | 96.5 /100 | #68 | Exceptional 5.1% |
| Immigrants | Northern Africa | 96.4 /100 | #69 | Exceptional 5.1% |
| Immigrants | Iraq | 96.4 /100 | #70 | Exceptional 5.1% |
| Paraguayans | 96.4 /100 | #71 | Exceptional 5.1% |
| Immigrants | Moldova | 96.4 /100 | #72 | Exceptional 5.1% |
| Slovenes | 96.2 /100 | #73 | Exceptional 5.2% |