Korean vs Immigrants from Northern Europe Unemployment Among Youth under 25 years
COMPARE
Korean
Immigrants from Northern Europe
Unemployment Among Youth under 25 years
Unemployment Among Youth under 25 years Comparison
Koreans
Immigrants from Northern Europe
11.7%
UNEMPLOYMENT AMONG YOUTH UNDER 25 YEARS
23.9/ 100
METRIC RATING
197th/ 347
METRIC RANK
11.5%
UNEMPLOYMENT AMONG YOUTH UNDER 25 YEARS
72.1/ 100
METRIC RATING
148th/ 347
METRIC RANK
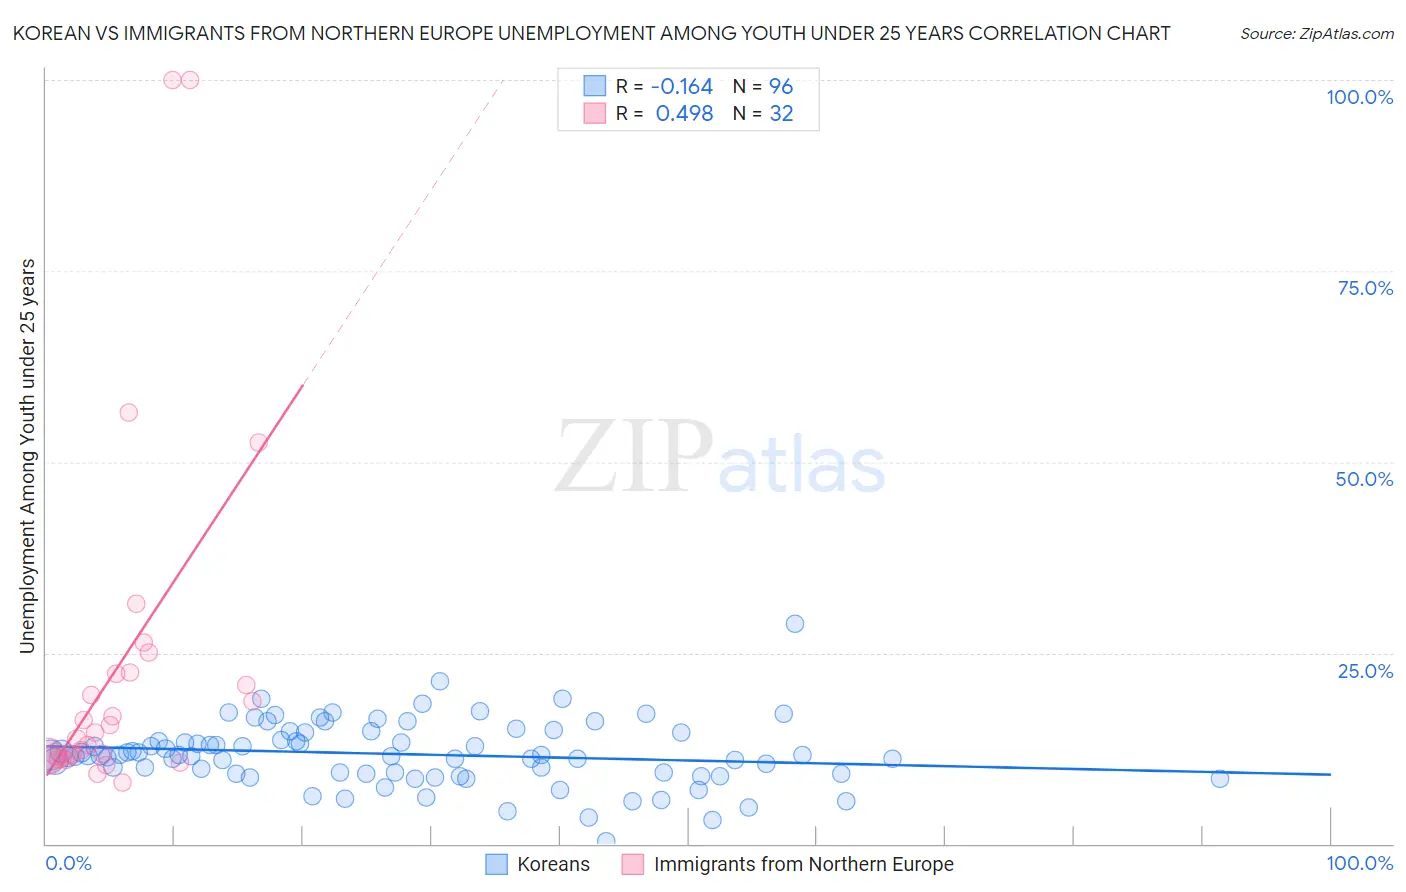
Korean vs Immigrants from Northern Europe Unemployment Among Youth under 25 years Correlation Chart
The statistical analysis conducted on geographies consisting of 499,778,315 people shows a poor negative correlation between the proportion of Koreans and unemployment rate among youth under the age of 25 in the United States with a correlation coefficient (R) of -0.164 and weighted average of 11.7%. Similarly, the statistical analysis conducted on geographies consisting of 467,129,993 people shows a moderate positive correlation between the proportion of Immigrants from Northern Europe and unemployment rate among youth under the age of 25 in the United States with a correlation coefficient (R) of 0.498 and weighted average of 11.5%, a difference of 2.2%.
Unemployment Among Youth under 25 years Correlation Summary
| Measurement | Korean | Immigrants from Northern Europe |
| Minimum | 0.30% | 8.0% |
| Maximum | 28.8% | 100.0% |
| Range | 28.5% | 92.0% |
| Mean | 11.8% | 23.1% |
| Median | 11.6% | 14.2% |
| Interquartile 25% (IQ1) | 9.2% | 11.3% |
| Interquartile 75% (IQ3) | 14.1% | 22.3% |
| Interquartile Range (IQR) | 4.9% | 11.0% |
| Standard Deviation (Sample) | 4.2% | 23.0% |
| Standard Deviation (Population) | 4.2% | 22.7% |
Similar Demographics by Unemployment Among Youth under 25 years
Demographics Similar to Koreans by Unemployment Among Youth under 25 years
In terms of unemployment among youth under 25 years, the demographic groups most similar to Koreans are Egyptian (11.7%, a difference of 0.16%), Cherokee (11.8%, a difference of 0.16%), Immigrants from Colombia (11.8%, a difference of 0.17%), Paraguayan (11.7%, a difference of 0.18%), and Seminole (11.7%, a difference of 0.21%).
| Demographics | Rating | Rank | Unemployment Among Youth under 25 years |
| Portuguese | 30.3 /100 | #190 | Fair 11.7% |
| Cypriots | 28.5 /100 | #191 | Fair 11.7% |
| Immigrants | Russia | 28.5 /100 | #192 | Fair 11.7% |
| Seminole | 27.9 /100 | #193 | Fair 11.7% |
| Immigrants | Sri Lanka | 27.8 /100 | #194 | Fair 11.7% |
| Paraguayans | 27.2 /100 | #195 | Fair 11.7% |
| Egyptians | 26.9 /100 | #196 | Fair 11.7% |
| Koreans | 23.9 /100 | #197 | Fair 11.7% |
| Cherokee | 21.2 /100 | #198 | Fair 11.8% |
| Immigrants | Colombia | 20.9 /100 | #199 | Fair 11.8% |
| Arabs | 18.0 /100 | #200 | Poor 11.8% |
| Palestinians | 16.0 /100 | #201 | Poor 11.8% |
| Marshallese | 15.8 /100 | #202 | Poor 11.8% |
| Immigrants | Peru | 15.3 /100 | #203 | Poor 11.8% |
| Immigrants | Costa Rica | 15.2 /100 | #204 | Poor 11.8% |
Demographics Similar to Immigrants from Northern Europe by Unemployment Among Youth under 25 years
In terms of unemployment among youth under 25 years, the demographic groups most similar to Immigrants from Northern Europe are Immigrants from Cambodia (11.5%, a difference of 0.010%), Brazilian (11.5%, a difference of 0.020%), Laotian (11.5%, a difference of 0.020%), Immigrants from Switzerland (11.5%, a difference of 0.020%), and Argentinean (11.5%, a difference of 0.050%).
| Demographics | Rating | Rank | Unemployment Among Youth under 25 years |
| Immigrants | Uruguay | 76.1 /100 | #141 | Good 11.5% |
| Immigrants | Korea | 75.1 /100 | #142 | Good 11.5% |
| Immigrants | Uganda | 74.5 /100 | #143 | Good 11.5% |
| Immigrants | Brazil | 74.3 /100 | #144 | Good 11.5% |
| Argentineans | 73.0 /100 | #145 | Good 11.5% |
| Brazilians | 72.5 /100 | #146 | Good 11.5% |
| Laotians | 72.4 /100 | #147 | Good 11.5% |
| Immigrants | Northern Europe | 72.1 /100 | #148 | Good 11.5% |
| Immigrants | Cambodia | 71.8 /100 | #149 | Good 11.5% |
| Immigrants | Switzerland | 71.6 /100 | #150 | Good 11.5% |
| Uruguayans | 70.4 /100 | #151 | Good 11.5% |
| Iraqis | 68.3 /100 | #152 | Good 11.5% |
| Immigrants | Czechoslovakia | 67.1 /100 | #153 | Good 11.5% |
| Immigrants | Asia | 66.7 /100 | #154 | Good 11.5% |
| Immigrants | Romania | 66.3 /100 | #155 | Good 11.5% |