Korean vs Estonian Unemployment Among Ages 20 to 24 years
COMPARE
Korean
Estonian
Unemployment Among Ages 20 to 24 years
Unemployment Among Ages 20 to 24 years Comparison
Koreans
Estonians
10.3%
UNEMPLOYMENT AMONG AGES 20 TO 24 YEARS
51.9/ 100
METRIC RATING
172nd/ 347
METRIC RANK
10.3%
UNEMPLOYMENT AMONG AGES 20 TO 24 YEARS
61.1/ 100
METRIC RATING
163rd/ 347
METRIC RANK
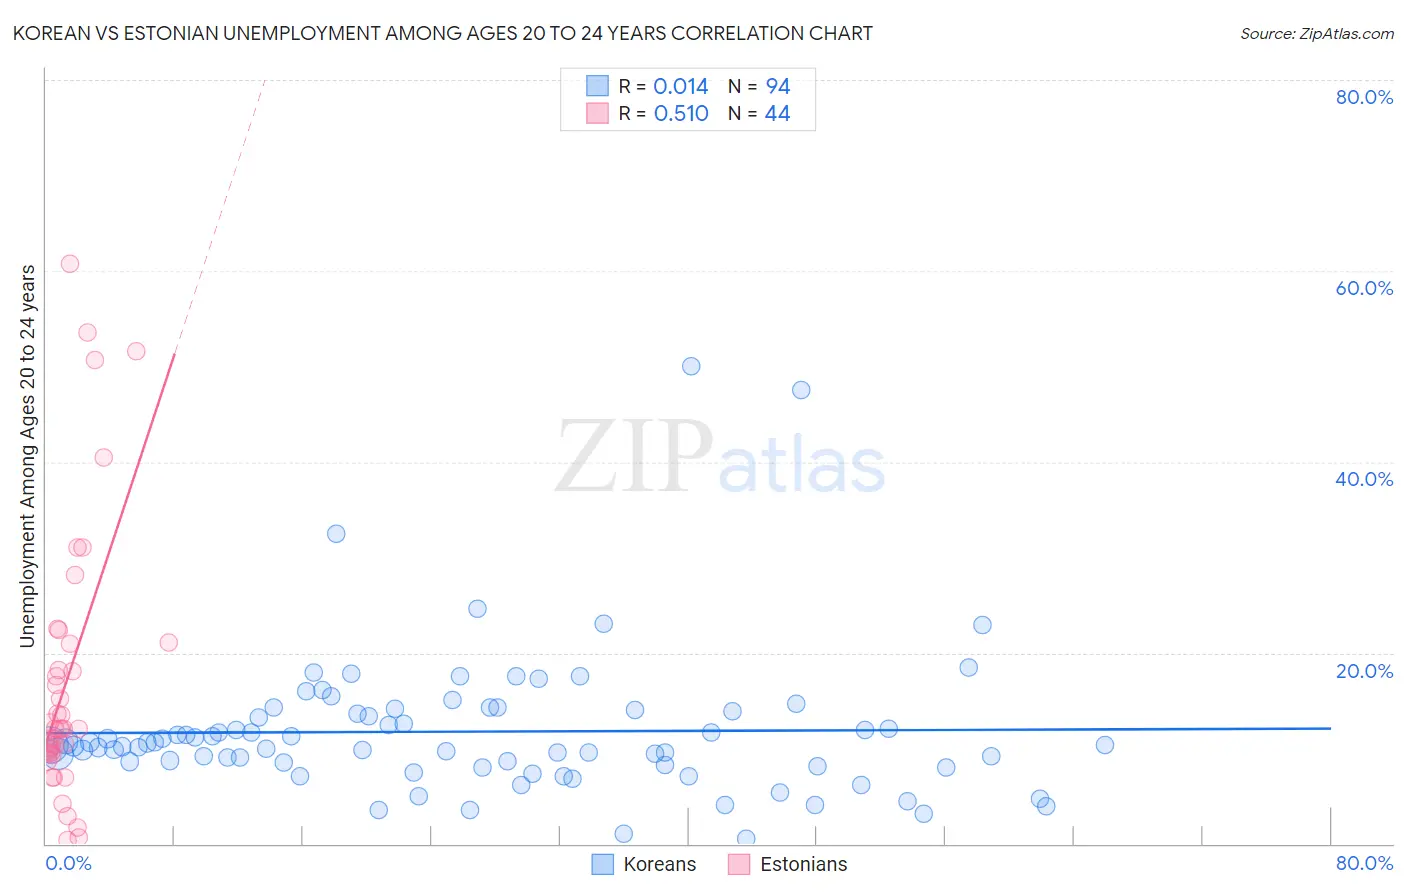
Korean vs Estonian Unemployment Among Ages 20 to 24 years Correlation Chart
The statistical analysis conducted on geographies consisting of 484,932,866 people shows no correlation between the proportion of Koreans and unemployment rate among population between the ages 20 and 24 in the United States with a correlation coefficient (R) of 0.014 and weighted average of 10.3%. Similarly, the statistical analysis conducted on geographies consisting of 121,978,605 people shows a substantial positive correlation between the proportion of Estonians and unemployment rate among population between the ages 20 and 24 in the United States with a correlation coefficient (R) of 0.510 and weighted average of 10.3%, a difference of 0.34%.
Unemployment Among Ages 20 to 24 years Correlation Summary
| Measurement | Korean | Estonian |
| Minimum | 0.50% | 0.40% |
| Maximum | 50.0% | 60.7% |
| Range | 49.5% | 60.3% |
| Mean | 11.7% | 17.3% |
| Median | 10.3% | 12.1% |
| Interquartile 25% (IQ1) | 8.3% | 9.5% |
| Interquartile 75% (IQ3) | 13.9% | 21.1% |
| Interquartile Range (IQR) | 5.6% | 11.5% |
| Standard Deviation (Sample) | 7.4% | 14.4% |
| Standard Deviation (Population) | 7.4% | 14.2% |
Demographics Similar to Koreans and Estonians by Unemployment Among Ages 20 to 24 years
In terms of unemployment among ages 20 to 24 years, the demographic groups most similar to Koreans are Immigrants from Eastern Asia (10.3%, a difference of 0.030%), Immigrants from Sweden (10.3%, a difference of 0.040%), Ukrainian (10.3%, a difference of 0.070%), Turkish (10.3%, a difference of 0.12%), and Immigrants from Colombia (10.3%, a difference of 0.16%). Similarly, the demographic groups most similar to Estonians are Immigrants from Asia (10.3%, a difference of 0.010%), Indian (Asian) (10.3%, a difference of 0.060%), Immigrants from Korea (10.3%, a difference of 0.080%), Spaniard (10.3%, a difference of 0.090%), and Immigrants from England (10.3%, a difference of 0.10%).
| Demographics | Rating | Rank | Unemployment Among Ages 20 to 24 years |
| Immigrants | Uganda | 65.6 /100 | #157 | Good 10.2% |
| Immigrants | Kazakhstan | 65.5 /100 | #158 | Good 10.2% |
| Immigrants | England | 63.7 /100 | #159 | Good 10.3% |
| Spaniards | 63.4 /100 | #160 | Good 10.3% |
| Indians (Asian) | 62.6 /100 | #161 | Good 10.3% |
| Immigrants | Asia | 61.3 /100 | #162 | Good 10.3% |
| Estonians | 61.1 /100 | #163 | Good 10.3% |
| Immigrants | Korea | 59.0 /100 | #164 | Average 10.3% |
| Lebanese | 58.3 /100 | #165 | Average 10.3% |
| Italians | 57.7 /100 | #166 | Average 10.3% |
| Immigrants | Fiji | 57.6 /100 | #167 | Average 10.3% |
| Iraqis | 56.7 /100 | #168 | Average 10.3% |
| Immigrants | Colombia | 56.3 /100 | #169 | Average 10.3% |
| Turks | 55.2 /100 | #170 | Average 10.3% |
| Immigrants | Eastern Asia | 52.7 /100 | #171 | Average 10.3% |
| Koreans | 51.9 /100 | #172 | Average 10.3% |
| Immigrants | Sweden | 50.8 /100 | #173 | Average 10.3% |
| Ukrainians | 50.0 /100 | #174 | Average 10.3% |
| Samoans | 45.4 /100 | #175 | Average 10.3% |
| Potawatomi | 42.0 /100 | #176 | Average 10.3% |
| Immigrants | Czechoslovakia | 40.8 /100 | #177 | Average 10.3% |