Kiowa vs Ethiopian Unemployment Among Women with Children Under 6 years
COMPARE
Kiowa
Ethiopian
Unemployment Among Women with Children Under 6 years
Unemployment Among Women with Children Under 6 years Comparison
Kiowa
Ethiopians
8.0%
UNEMPLOYMENT AMONG WOMEN WITH CHILDREN UNDER 6 YEARS
4.4/ 100
METRIC RATING
234th/ 347
METRIC RANK
6.8%
UNEMPLOYMENT AMONG WOMEN WITH CHILDREN UNDER 6 YEARS
99.9/ 100
METRIC RATING
51st/ 347
METRIC RANK
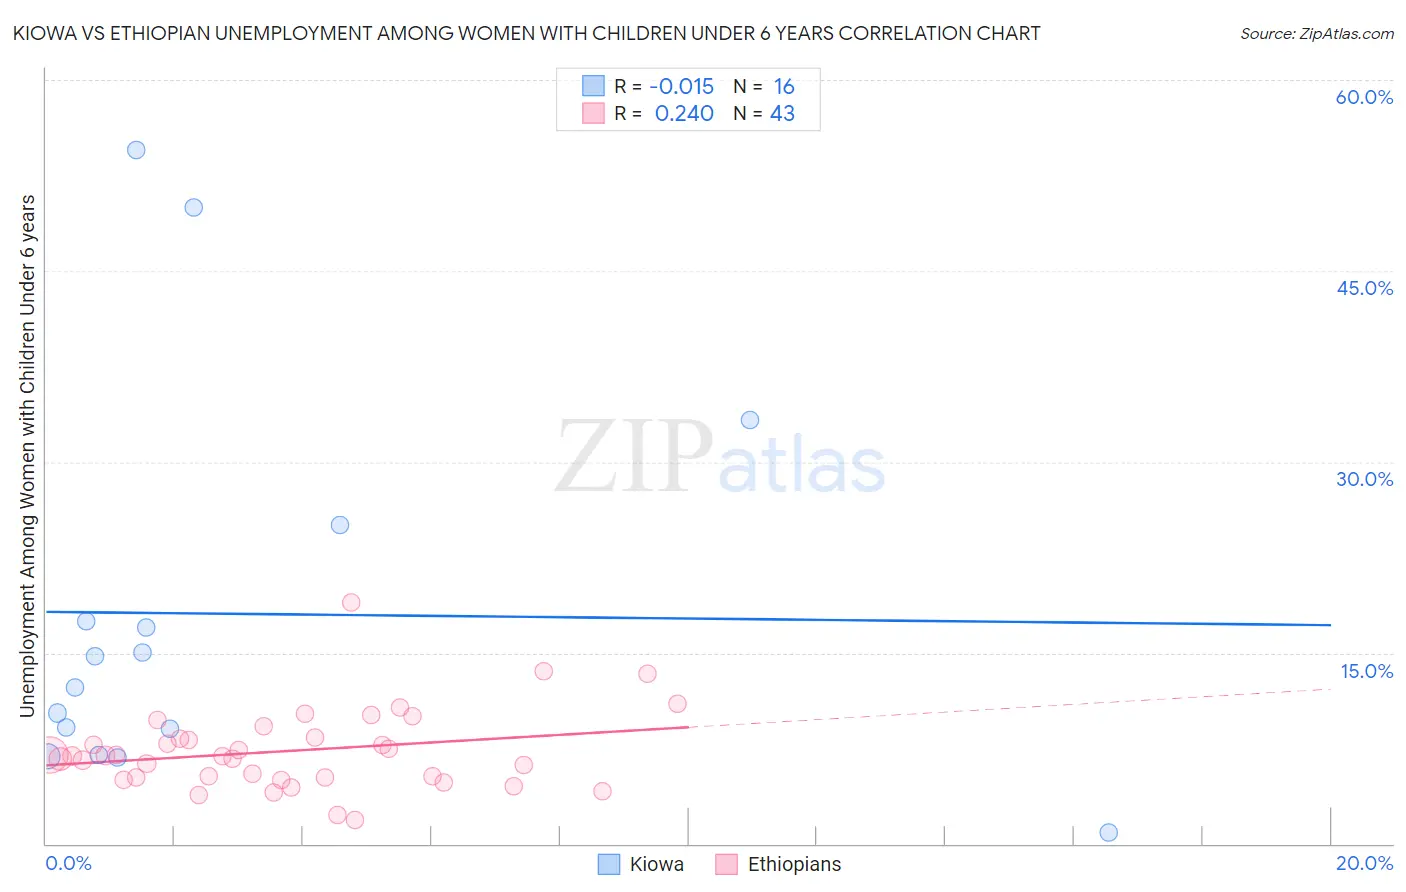
Kiowa vs Ethiopian Unemployment Among Women with Children Under 6 years Correlation Chart
The statistical analysis conducted on geographies consisting of 51,955,619 people shows no correlation between the proportion of Kiowa and unemployment rate among women with children under the age of 6 in the United States with a correlation coefficient (R) of -0.015 and weighted average of 8.0%. Similarly, the statistical analysis conducted on geographies consisting of 190,123,801 people shows a weak positive correlation between the proportion of Ethiopians and unemployment rate among women with children under the age of 6 in the United States with a correlation coefficient (R) of 0.240 and weighted average of 6.8%, a difference of 18.4%.
Unemployment Among Women with Children Under 6 years Correlation Summary
| Measurement | Kiowa | Ethiopian |
| Minimum | 0.90% | 1.9% |
| Maximum | 54.5% | 19.0% |
| Range | 53.6% | 17.1% |
| Mean | 18.1% | 7.3% |
| Median | 13.5% | 6.9% |
| Interquartile 25% (IQ1) | 8.0% | 5.2% |
| Interquartile 75% (IQ3) | 21.2% | 8.4% |
| Interquartile Range (IQR) | 13.2% | 3.2% |
| Standard Deviation (Sample) | 15.4% | 3.2% |
| Standard Deviation (Population) | 15.0% | 3.1% |
Similar Demographics by Unemployment Among Women with Children Under 6 years
Demographics Similar to Kiowa by Unemployment Among Women with Children Under 6 years
In terms of unemployment among women with children under 6 years, the demographic groups most similar to Kiowa are Comanche (8.0%, a difference of 0.040%), Immigrants from Barbados (8.0%, a difference of 0.050%), Immigrants from Costa Rica (8.0%, a difference of 0.12%), Immigrants from Trinidad and Tobago (8.0%, a difference of 0.15%), and Welsh (8.0%, a difference of 0.23%).
| Demographics | Rating | Rank | Unemployment Among Women with Children Under 6 years |
| Portuguese | 6.2 /100 | #227 | Tragic 8.0% |
| Immigrants | Sudan | 6.0 /100 | #228 | Tragic 8.0% |
| Salvadorans | 5.5 /100 | #229 | Tragic 8.0% |
| Finns | 5.3 /100 | #230 | Tragic 8.0% |
| Trinidadians and Tobagonians | 5.3 /100 | #231 | Tragic 8.0% |
| Welsh | 5.0 /100 | #232 | Tragic 8.0% |
| Immigrants | Trinidad and Tobago | 4.8 /100 | #233 | Tragic 8.0% |
| Kiowa | 4.4 /100 | #234 | Tragic 8.0% |
| Comanche | 4.3 /100 | #235 | Tragic 8.0% |
| Immigrants | Barbados | 4.2 /100 | #236 | Tragic 8.0% |
| Immigrants | Costa Rica | 4.1 /100 | #237 | Tragic 8.0% |
| Immigrants | Middle Africa | 3.2 /100 | #238 | Tragic 8.1% |
| Irish | 2.7 /100 | #239 | Tragic 8.1% |
| Immigrants | El Salvador | 2.6 /100 | #240 | Tragic 8.1% |
| Liberians | 2.6 /100 | #241 | Tragic 8.1% |
Demographics Similar to Ethiopians by Unemployment Among Women with Children Under 6 years
In terms of unemployment among women with children under 6 years, the demographic groups most similar to Ethiopians are Immigrants from Nepal (6.8%, a difference of 0.020%), Immigrants from Ireland (6.8%, a difference of 0.020%), Immigrants from Switzerland (6.8%, a difference of 0.080%), Immigrants from Asia (6.8%, a difference of 0.11%), and Immigrants from Iran (6.8%, a difference of 0.11%).
| Demographics | Rating | Rank | Unemployment Among Women with Children Under 6 years |
| Iranians | 99.9 /100 | #44 | Exceptional 6.7% |
| Immigrants | Australia | 99.9 /100 | #45 | Exceptional 6.8% |
| Latvians | 99.9 /100 | #46 | Exceptional 6.8% |
| Immigrants | Asia | 99.9 /100 | #47 | Exceptional 6.8% |
| Immigrants | Switzerland | 99.9 /100 | #48 | Exceptional 6.8% |
| Immigrants | Nepal | 99.9 /100 | #49 | Exceptional 6.8% |
| Immigrants | Ireland | 99.9 /100 | #50 | Exceptional 6.8% |
| Ethiopians | 99.9 /100 | #51 | Exceptional 6.8% |
| Immigrants | Iran | 99.9 /100 | #52 | Exceptional 6.8% |
| Chinese | 99.9 /100 | #53 | Exceptional 6.8% |
| Immigrants | Latvia | 99.9 /100 | #54 | Exceptional 6.8% |
| Immigrants | Ukraine | 99.8 /100 | #55 | Exceptional 6.8% |
| Immigrants | Ethiopia | 99.8 /100 | #56 | Exceptional 6.9% |
| Icelanders | 99.8 /100 | #57 | Exceptional 6.9% |
| Immigrants | Turkey | 99.8 /100 | #58 | Exceptional 6.9% |