Kenyan vs Jordanian Unemployment Among Ages 16 to 19 years
COMPARE
Kenyan
Jordanian
Unemployment Among Ages 16 to 19 years
Unemployment Among Ages 16 to 19 years Comparison
Kenyans
Jordanians
16.1%
UNEMPLOYMENT AMONG AGES 16 TO 19 YEARS
99.9/ 100
METRIC RATING
30th/ 347
METRIC RANK
16.0%
UNEMPLOYMENT AMONG AGES 16 TO 19 YEARS
99.9/ 100
METRIC RATING
28th/ 347
METRIC RANK
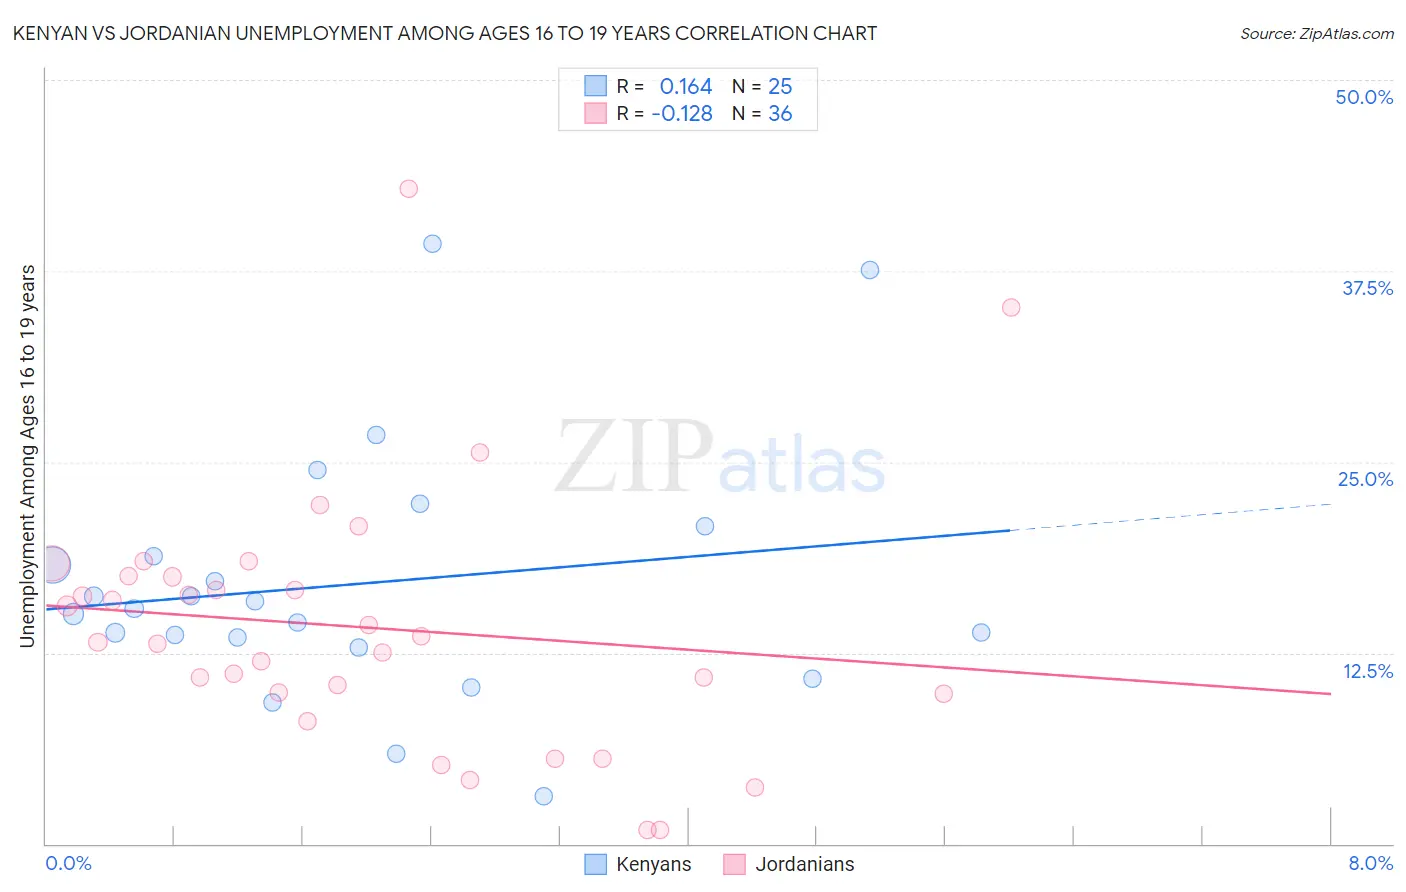
Kenyan vs Jordanian Unemployment Among Ages 16 to 19 years Correlation Chart
The statistical analysis conducted on geographies consisting of 165,173,140 people shows a poor positive correlation between the proportion of Kenyans and unemployment rate among population between the ages 16 and 19 in the United States with a correlation coefficient (R) of 0.164 and weighted average of 16.1%. Similarly, the statistical analysis conducted on geographies consisting of 163,062,252 people shows a poor negative correlation between the proportion of Jordanians and unemployment rate among population between the ages 16 and 19 in the United States with a correlation coefficient (R) of -0.128 and weighted average of 16.0%, a difference of 0.090%.
Unemployment Among Ages 16 to 19 years Correlation Summary
| Measurement | Kenyan | Jordanian |
| Minimum | 3.1% | 0.90% |
| Maximum | 39.3% | 42.9% |
| Range | 36.2% | 42.0% |
| Mean | 17.0% | 14.2% |
| Median | 15.4% | 13.4% |
| Interquartile 25% (IQ1) | 13.1% | 9.9% |
| Interquartile 75% (IQ3) | 19.8% | 17.5% |
| Interquartile Range (IQR) | 6.7% | 7.6% |
| Standard Deviation (Sample) | 8.3% | 8.5% |
| Standard Deviation (Population) | 8.1% | 8.4% |
Demographics Similar to Kenyans and Jordanians by Unemployment Among Ages 16 to 19 years
In terms of unemployment among ages 16 to 19 years, the demographic groups most similar to Kenyans are Chinese (16.0%, a difference of 0.040%), English (16.1%, a difference of 0.050%), Immigrants from Sudan (16.0%, a difference of 0.27%), European (16.1%, a difference of 0.45%), and Dutch (15.9%, a difference of 0.74%). Similarly, the demographic groups most similar to Jordanians are Chinese (16.0%, a difference of 0.050%), English (16.1%, a difference of 0.14%), Immigrants from Sudan (16.0%, a difference of 0.18%), European (16.1%, a difference of 0.54%), and Dutch (15.9%, a difference of 0.65%).
| Demographics | Rating | Rank | Unemployment Among Ages 16 to 19 years |
| Swiss | 100.0 /100 | #19 | Exceptional 15.8% |
| Sudanese | 100.0 /100 | #20 | Exceptional 15.8% |
| Immigrants | Taiwan | 100.0 /100 | #21 | Exceptional 15.8% |
| Finns | 100.0 /100 | #22 | Exceptional 15.9% |
| Belgians | 100.0 /100 | #23 | Exceptional 15.9% |
| Tongans | 100.0 /100 | #24 | Exceptional 15.9% |
| Filipinos | 100.0 /100 | #25 | Exceptional 15.9% |
| Dutch | 100.0 /100 | #26 | Exceptional 15.9% |
| Immigrants | Sudan | 99.9 /100 | #27 | Exceptional 16.0% |
| Jordanians | 99.9 /100 | #28 | Exceptional 16.0% |
| Chinese | 99.9 /100 | #29 | Exceptional 16.0% |
| Kenyans | 99.9 /100 | #30 | Exceptional 16.1% |
| English | 99.9 /100 | #31 | Exceptional 16.1% |
| Europeans | 99.9 /100 | #32 | Exceptional 16.1% |
| Immigrants | Kenya | 99.9 /100 | #33 | Exceptional 16.2% |
| Pennsylvania Germans | 99.9 /100 | #34 | Exceptional 16.2% |
| Scottish | 99.8 /100 | #35 | Exceptional 16.2% |
| Immigrants | South Central Asia | 99.8 /100 | #36 | Exceptional 16.2% |
| Immigrants | Congo | 99.8 /100 | #37 | Exceptional 16.3% |
| Bulgarians | 99.8 /100 | #38 | Exceptional 16.3% |
| Croatians | 99.8 /100 | #39 | Exceptional 16.3% |