Kenyan vs Immigrants from Cambodia Unemployment Among Women with Children Under 18 years
COMPARE
Kenyan
Immigrants from Cambodia
Unemployment Among Women with Children Under 18 years
Unemployment Among Women with Children Under 18 years Comparison
Kenyans
Immigrants from Cambodia
5.3%
UNEMPLOYMENT AMONG WOMEN WITH CHILDREN UNDER 18 YEARS
88.2/ 100
METRIC RATING
114th/ 347
METRIC RANK
5.5%
UNEMPLOYMENT AMONG WOMEN WITH CHILDREN UNDER 18 YEARS
38.4/ 100
METRIC RATING
184th/ 347
METRIC RANK
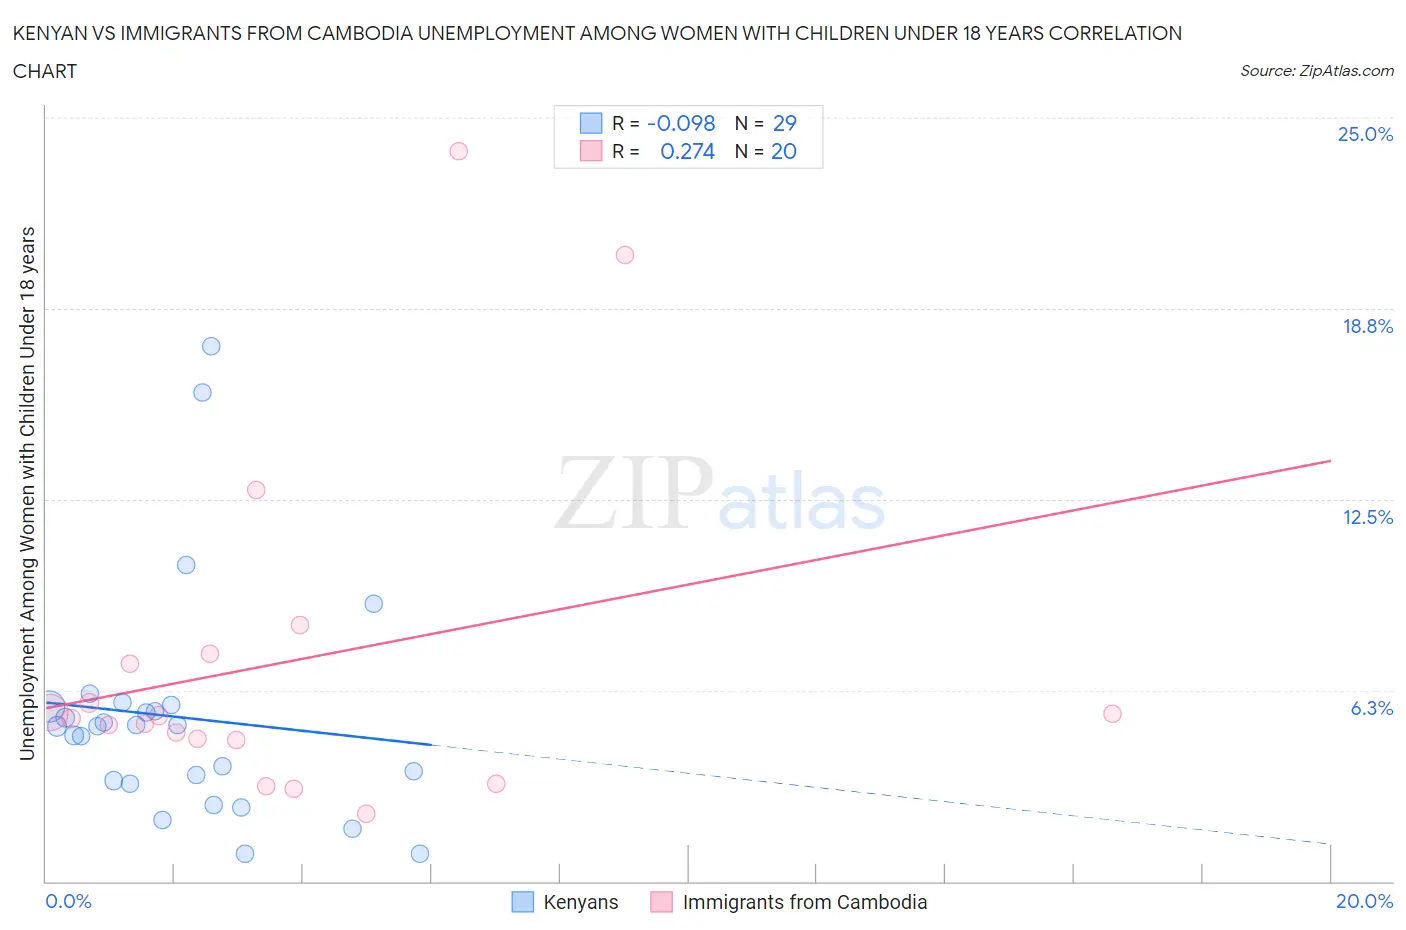
Kenyan vs Immigrants from Cambodia Unemployment Among Women with Children Under 18 years Correlation Chart
The statistical analysis conducted on geographies consisting of 165,742,176 people shows a slight negative correlation between the proportion of Kenyans and unemployment rate among women with children under the age of 18 in the United States with a correlation coefficient (R) of -0.098 and weighted average of 5.3%. Similarly, the statistical analysis conducted on geographies consisting of 201,816,037 people shows a weak positive correlation between the proportion of Immigrants from Cambodia and unemployment rate among women with children under the age of 18 in the United States with a correlation coefficient (R) of 0.274 and weighted average of 5.5%, a difference of 4.6%.
Unemployment Among Women with Children Under 18 years Correlation Summary
| Measurement | Kenyan | Immigrants from Cambodia |
| Minimum | 0.90% | 2.2% |
| Maximum | 17.5% | 23.9% |
| Range | 16.6% | 21.7% |
| Mean | 5.4% | 7.2% |
| Median | 5.1% | 5.4% |
| Interquartile 25% (IQ1) | 3.2% | 4.7% |
| Interquartile 75% (IQ3) | 5.8% | 7.3% |
| Interquartile Range (IQR) | 2.5% | 2.6% |
| Standard Deviation (Sample) | 3.8% | 5.6% |
| Standard Deviation (Population) | 3.7% | 5.5% |
Similar Demographics by Unemployment Among Women with Children Under 18 years
Demographics Similar to Kenyans by Unemployment Among Women with Children Under 18 years
In terms of unemployment among women with children under 18 years, the demographic groups most similar to Kenyans are Hungarian (5.3%, a difference of 0.010%), French (5.2%, a difference of 0.040%), Immigrants from Eastern Europe (5.2%, a difference of 0.050%), Macedonian (5.3%, a difference of 0.080%), and Immigrants from Czechoslovakia (5.2%, a difference of 0.13%).
| Demographics | Rating | Rank | Unemployment Among Women with Children Under 18 years |
| Slavs | 89.8 /100 | #107 | Excellent 5.2% |
| Iranians | 89.7 /100 | #108 | Excellent 5.2% |
| Immigrants | Russia | 89.0 /100 | #109 | Excellent 5.2% |
| Immigrants | Czechoslovakia | 88.9 /100 | #110 | Excellent 5.2% |
| French Canadians | 88.9 /100 | #111 | Excellent 5.2% |
| Immigrants | Eastern Europe | 88.5 /100 | #112 | Excellent 5.2% |
| French | 88.4 /100 | #113 | Excellent 5.2% |
| Kenyans | 88.2 /100 | #114 | Excellent 5.3% |
| Hungarians | 88.1 /100 | #115 | Excellent 5.3% |
| Macedonians | 87.7 /100 | #116 | Excellent 5.3% |
| Canadians | 87.4 /100 | #117 | Excellent 5.3% |
| Immigrants | Europe | 86.7 /100 | #118 | Excellent 5.3% |
| Basques | 86.5 /100 | #119 | Excellent 5.3% |
| Egyptians | 86.4 /100 | #120 | Excellent 5.3% |
| Immigrants | Romania | 85.8 /100 | #121 | Excellent 5.3% |
Demographics Similar to Immigrants from Cambodia by Unemployment Among Women with Children Under 18 years
In terms of unemployment among women with children under 18 years, the demographic groups most similar to Immigrants from Cambodia are Immigrants from Zaire (5.5%, a difference of 0.020%), Immigrants from Laos (5.5%, a difference of 0.030%), Indonesian (5.5%, a difference of 0.15%), Immigrants from Sudan (5.5%, a difference of 0.16%), and Malaysian (5.5%, a difference of 0.21%).
| Demographics | Rating | Rank | Unemployment Among Women with Children Under 18 years |
| Hawaiians | 46.1 /100 | #177 | Average 5.5% |
| Costa Ricans | 45.2 /100 | #178 | Average 5.5% |
| Syrians | 42.8 /100 | #179 | Average 5.5% |
| Immigrants | Southern Europe | 42.7 /100 | #180 | Average 5.5% |
| Immigrants | Hungary | 41.3 /100 | #181 | Average 5.5% |
| Immigrants | Sudan | 40.6 /100 | #182 | Average 5.5% |
| Immigrants | Laos | 38.8 /100 | #183 | Fair 5.5% |
| Immigrants | Cambodia | 38.4 /100 | #184 | Fair 5.5% |
| Immigrants | Zaire | 38.1 /100 | #185 | Fair 5.5% |
| Indonesians | 36.3 /100 | #186 | Fair 5.5% |
| Malaysians | 35.7 /100 | #187 | Fair 5.5% |
| Iraqis | 35.3 /100 | #188 | Fair 5.5% |
| Immigrants | Eritrea | 33.8 /100 | #189 | Fair 5.5% |
| Immigrants | Poland | 31.2 /100 | #190 | Fair 5.5% |
| South American Indians | 30.8 /100 | #191 | Fair 5.5% |