Kenyan vs Haitian Unemployment Among Ages 20 to 24 years
COMPARE
Kenyan
Haitian
Unemployment Among Ages 20 to 24 years
Unemployment Among Ages 20 to 24 years Comparison
Kenyans
Haitians
9.9%
UNEMPLOYMENT AMONG AGES 20 TO 24 YEARS
98.7/ 100
METRIC RATING
73rd/ 347
METRIC RANK
12.2%
UNEMPLOYMENT AMONG AGES 20 TO 24 YEARS
0.0/ 100
METRIC RATING
303rd/ 347
METRIC RANK
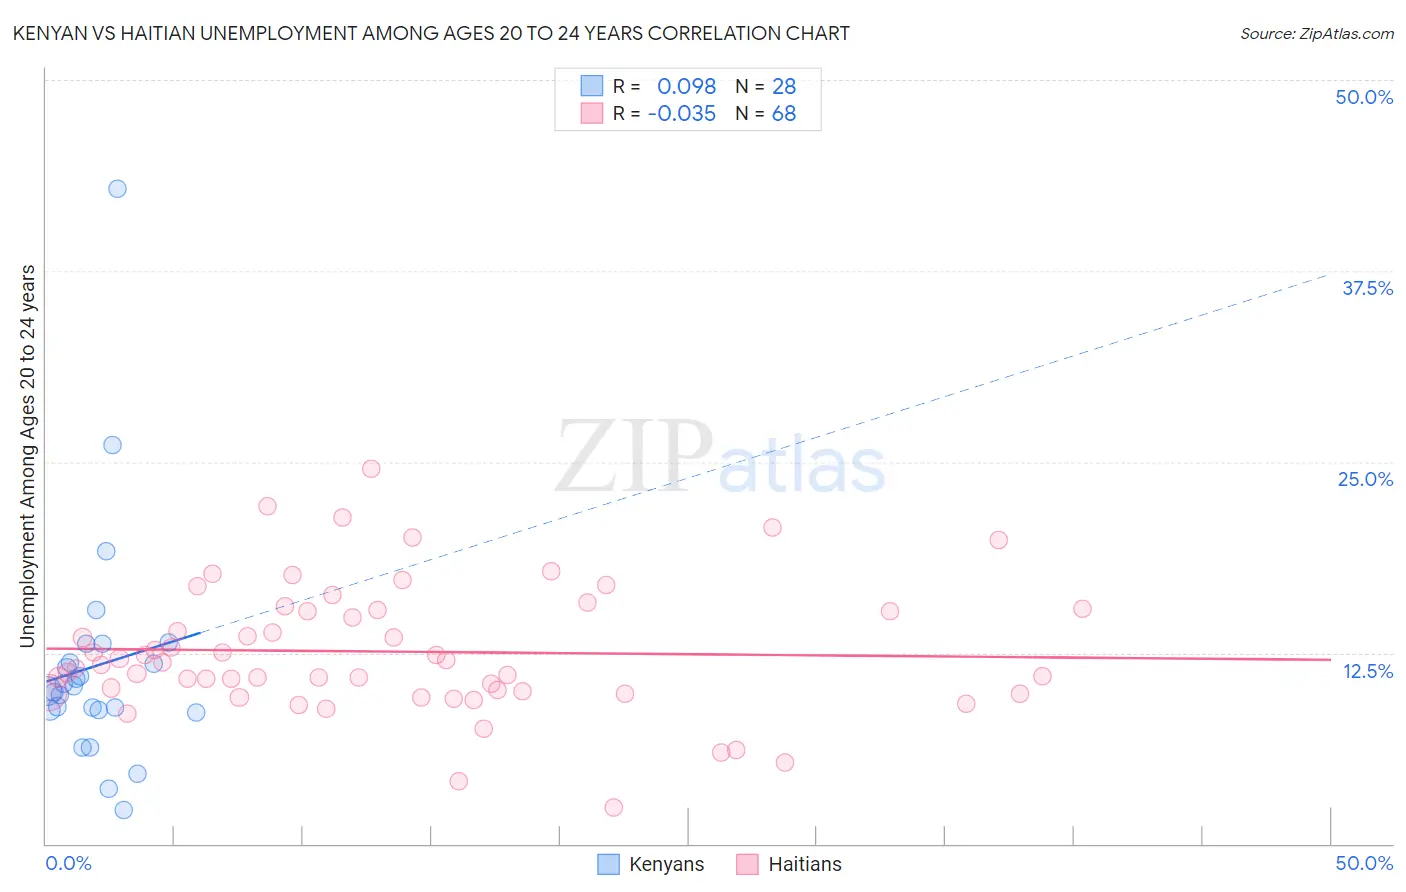
Kenyan vs Haitian Unemployment Among Ages 20 to 24 years Correlation Chart
The statistical analysis conducted on geographies consisting of 166,817,743 people shows a slight positive correlation between the proportion of Kenyans and unemployment rate among population between the ages 20 and 24 in the United States with a correlation coefficient (R) of 0.098 and weighted average of 9.9%. Similarly, the statistical analysis conducted on geographies consisting of 282,021,864 people shows no correlation between the proportion of Haitians and unemployment rate among population between the ages 20 and 24 in the United States with a correlation coefficient (R) of -0.035 and weighted average of 12.2%, a difference of 23.5%.
Unemployment Among Ages 20 to 24 years Correlation Summary
| Measurement | Kenyan | Haitian |
| Minimum | 2.2% | 2.4% |
| Maximum | 42.9% | 24.6% |
| Range | 40.7% | 22.2% |
| Mean | 11.6% | 12.6% |
| Median | 10.2% | 11.8% |
| Interquartile 25% (IQ1) | 8.7% | 9.9% |
| Interquartile 75% (IQ3) | 12.5% | 15.3% |
| Interquartile Range (IQR) | 3.7% | 5.3% |
| Standard Deviation (Sample) | 7.7% | 4.2% |
| Standard Deviation (Population) | 7.5% | 4.2% |
Similar Demographics by Unemployment Among Ages 20 to 24 years
Demographics Similar to Kenyans by Unemployment Among Ages 20 to 24 years
In terms of unemployment among ages 20 to 24 years, the demographic groups most similar to Kenyans are Immigrants from Laos (9.9%, a difference of 0.030%), Immigrants from Australia (9.9%, a difference of 0.10%), Bolivian (9.9%, a difference of 0.14%), Celtic (9.9%, a difference of 0.18%), and Czechoslovakian (9.9%, a difference of 0.19%).
| Demographics | Rating | Rank | Unemployment Among Ages 20 to 24 years |
| Scottish | 99.3 /100 | #66 | Exceptional 9.8% |
| Immigrants | Bolivia | 99.2 /100 | #67 | Exceptional 9.9% |
| Mongolians | 99.1 /100 | #68 | Exceptional 9.9% |
| Bulgarians | 99.1 /100 | #69 | Exceptional 9.9% |
| Immigrants | Croatia | 99.0 /100 | #70 | Exceptional 9.9% |
| Celtics | 98.9 /100 | #71 | Exceptional 9.9% |
| Bolivians | 98.9 /100 | #72 | Exceptional 9.9% |
| Kenyans | 98.7 /100 | #73 | Exceptional 9.9% |
| Immigrants | Laos | 98.7 /100 | #74 | Exceptional 9.9% |
| Immigrants | Australia | 98.6 /100 | #75 | Exceptional 9.9% |
| Czechoslovakians | 98.4 /100 | #76 | Exceptional 9.9% |
| Chickasaw | 98.4 /100 | #77 | Exceptional 9.9% |
| Assyrians/Chaldeans/Syriacs | 98.3 /100 | #78 | Exceptional 9.9% |
| Icelanders | 98.3 /100 | #79 | Exceptional 9.9% |
| Immigrants | Netherlands | 98.2 /100 | #80 | Exceptional 9.9% |
Demographics Similar to Haitians by Unemployment Among Ages 20 to 24 years
In terms of unemployment among ages 20 to 24 years, the demographic groups most similar to Haitians are Immigrants from Cabo Verde (12.2%, a difference of 0.020%), Immigrants from West Indies (12.3%, a difference of 0.59%), Chippewa (12.3%, a difference of 0.64%), Immigrants from Sierra Leone (12.1%, a difference of 0.87%), and Spanish American Indian (12.1%, a difference of 1.4%).
| Demographics | Rating | Rank | Unemployment Among Ages 20 to 24 years |
| Cajuns | 0.0 /100 | #296 | Tragic 12.0% |
| Blackfeet | 0.0 /100 | #297 | Tragic 12.0% |
| Lumbee | 0.0 /100 | #298 | Tragic 12.0% |
| Apache | 0.0 /100 | #299 | Tragic 12.0% |
| Spanish American Indians | 0.0 /100 | #300 | Tragic 12.1% |
| Immigrants | Sierra Leone | 0.0 /100 | #301 | Tragic 12.1% |
| Immigrants | Cabo Verde | 0.0 /100 | #302 | Tragic 12.2% |
| Haitians | 0.0 /100 | #303 | Tragic 12.2% |
| Immigrants | West Indies | 0.0 /100 | #304 | Tragic 12.3% |
| Chippewa | 0.0 /100 | #305 | Tragic 12.3% |
| Immigrants | Haiti | 0.0 /100 | #306 | Tragic 12.4% |
| Bermudans | 0.0 /100 | #307 | Tragic 12.5% |
| Tohono O'odham | 0.0 /100 | #308 | Tragic 12.5% |
| Immigrants | Bangladesh | 0.0 /100 | #309 | Tragic 12.6% |
| Jamaicans | 0.0 /100 | #310 | Tragic 12.6% |