Jordanian vs Samoan Unemployment Among Youth under 25 years
COMPARE
Jordanian
Samoan
Unemployment Among Youth under 25 years
Unemployment Among Youth under 25 years Comparison
Jordanians
Samoans
11.1%
UNEMPLOYMENT AMONG YOUTH UNDER 25 YEARS
97.9/ 100
METRIC RATING
64th/ 347
METRIC RANK
11.9%
UNEMPLOYMENT AMONG YOUTH UNDER 25 YEARS
7.4/ 100
METRIC RATING
215th/ 347
METRIC RANK
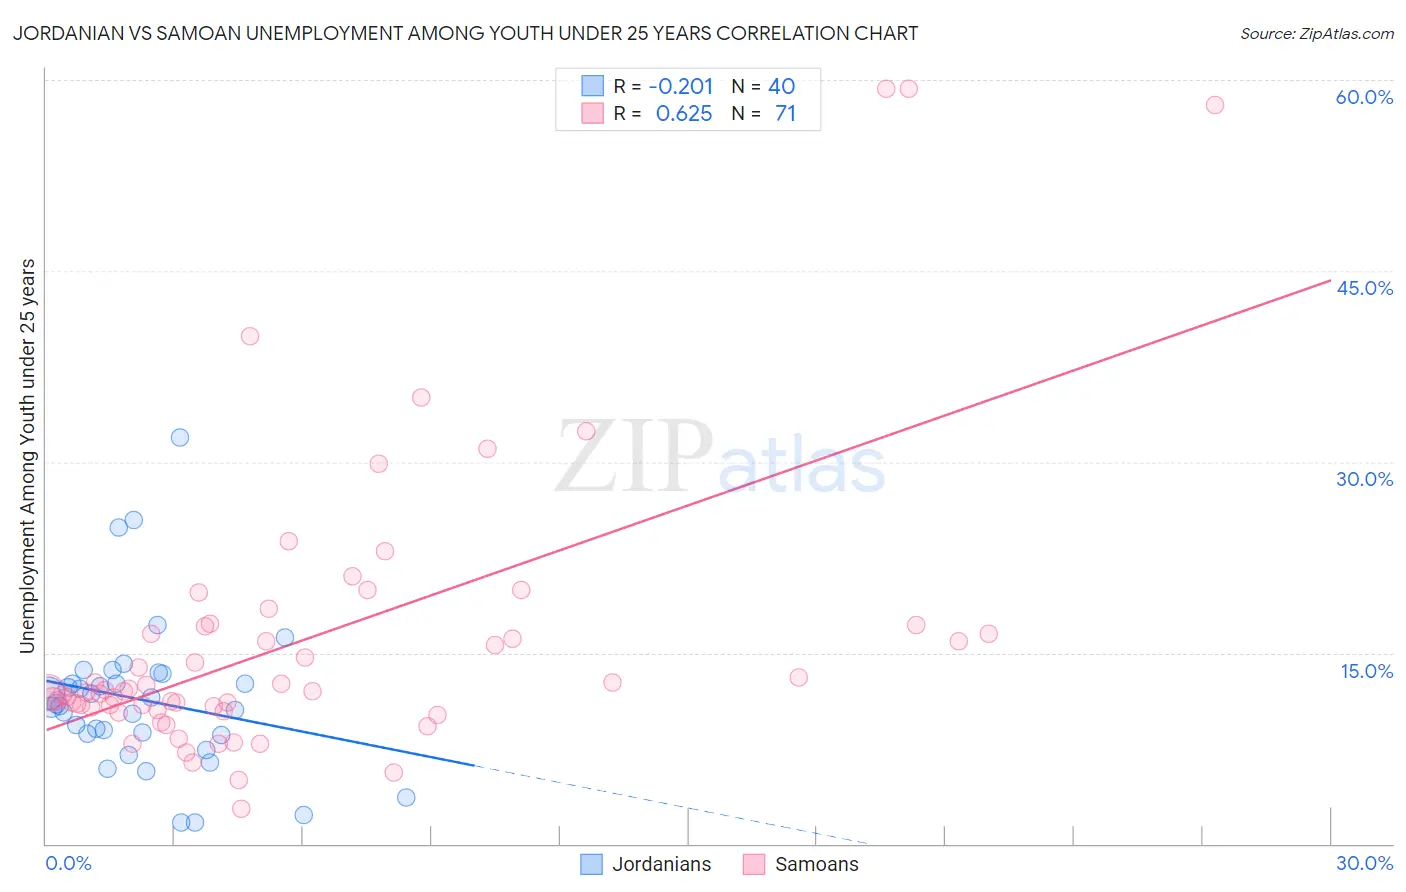
Jordanian vs Samoan Unemployment Among Youth under 25 years Correlation Chart
The statistical analysis conducted on geographies consisting of 165,992,229 people shows a weak negative correlation between the proportion of Jordanians and unemployment rate among youth under the age of 25 in the United States with a correlation coefficient (R) of -0.201 and weighted average of 11.1%. Similarly, the statistical analysis conducted on geographies consisting of 223,724,498 people shows a significant positive correlation between the proportion of Samoans and unemployment rate among youth under the age of 25 in the United States with a correlation coefficient (R) of 0.625 and weighted average of 11.9%, a difference of 6.8%.
Unemployment Among Youth under 25 years Correlation Summary
| Measurement | Jordanian | Samoan |
| Minimum | 1.7% | 2.8% |
| Maximum | 31.9% | 59.3% |
| Range | 30.2% | 56.5% |
| Mean | 11.3% | 15.9% |
| Median | 10.9% | 12.0% |
| Interquartile 25% (IQ1) | 8.6% | 10.7% |
| Interquartile 75% (IQ3) | 13.0% | 17.1% |
| Interquartile Range (IQR) | 4.4% | 6.5% |
| Standard Deviation (Sample) | 6.0% | 11.4% |
| Standard Deviation (Population) | 5.9% | 11.3% |
Similar Demographics by Unemployment Among Youth under 25 years
Demographics Similar to Jordanians by Unemployment Among Youth under 25 years
In terms of unemployment among youth under 25 years, the demographic groups most similar to Jordanians are Immigrants from Singapore (11.2%, a difference of 0.060%), Macedonian (11.2%, a difference of 0.090%), Chickasaw (11.2%, a difference of 0.11%), Immigrants from Croatia (11.1%, a difference of 0.12%), and Immigrants from Netherlands (11.1%, a difference of 0.13%).
| Demographics | Rating | Rank | Unemployment Among Youth under 25 years |
| Immigrants | Eritrea | 98.8 /100 | #57 | Exceptional 11.1% |
| Scotch-Irish | 98.8 /100 | #58 | Exceptional 11.1% |
| Immigrants | Eastern Africa | 98.7 /100 | #59 | Exceptional 11.1% |
| South Africans | 98.5 /100 | #60 | Exceptional 11.1% |
| Filipinos | 98.3 /100 | #61 | Exceptional 11.1% |
| Immigrants | Netherlands | 98.1 /100 | #62 | Exceptional 11.1% |
| Immigrants | Croatia | 98.1 /100 | #63 | Exceptional 11.1% |
| Jordanians | 97.9 /100 | #64 | Exceptional 11.1% |
| Immigrants | Singapore | 97.8 /100 | #65 | Exceptional 11.2% |
| Macedonians | 97.7 /100 | #66 | Exceptional 11.2% |
| Chickasaw | 97.7 /100 | #67 | Exceptional 11.2% |
| Immigrants | Kenya | 97.6 /100 | #68 | Exceptional 11.2% |
| Immigrants | Moldova | 97.5 /100 | #69 | Exceptional 11.2% |
| Slavs | 97.5 /100 | #70 | Exceptional 11.2% |
| Bhutanese | 97.4 /100 | #71 | Exceptional 11.2% |
Demographics Similar to Samoans by Unemployment Among Youth under 25 years
In terms of unemployment among youth under 25 years, the demographic groups most similar to Samoans are Guamanian/Chamorro (11.9%, a difference of 0.060%), Yaqui (11.9%, a difference of 0.070%), Immigrants from Middle Africa (11.9%, a difference of 0.080%), Costa Rican (11.9%, a difference of 0.11%), and South American (11.9%, a difference of 0.15%).
| Demographics | Rating | Rank | Unemployment Among Youth under 25 years |
| Comanche | 12.1 /100 | #208 | Poor 11.8% |
| Immigrants | Lebanon | 11.3 /100 | #209 | Poor 11.8% |
| Assyrians/Chaldeans/Syriacs | 9.8 /100 | #210 | Tragic 11.9% |
| Immigrants | Philippines | 9.2 /100 | #211 | Tragic 11.9% |
| Colombians | 9.1 /100 | #212 | Tragic 11.9% |
| South Americans | 8.5 /100 | #213 | Tragic 11.9% |
| Costa Ricans | 8.2 /100 | #214 | Tragic 11.9% |
| Samoans | 7.4 /100 | #215 | Tragic 11.9% |
| Guamanians/Chamorros | 7.0 /100 | #216 | Tragic 11.9% |
| Yaqui | 6.9 /100 | #217 | Tragic 11.9% |
| Immigrants | Middle Africa | 6.8 /100 | #218 | Tragic 11.9% |
| Immigrants | Nonimmigrants | 6.2 /100 | #219 | Tragic 11.9% |
| Alsatians | 6.1 /100 | #220 | Tragic 11.9% |
| Immigrants | Portugal | 4.9 /100 | #221 | Tragic 12.0% |
| Israelis | 4.1 /100 | #222 | Tragic 12.0% |