Jordanian vs Native/Alaskan Unemployment Among Ages 16 to 19 years
COMPARE
Jordanian
Native/Alaskan
Unemployment Among Ages 16 to 19 years
Unemployment Among Ages 16 to 19 years Comparison
Jordanians
Natives/Alaskans
16.0%
UNEMPLOYMENT AMONG AGES 16 TO 19 YEARS
99.9/ 100
METRIC RATING
28th/ 347
METRIC RANK
21.5%
UNEMPLOYMENT AMONG AGES 16 TO 19 YEARS
0.0/ 100
METRIC RATING
309th/ 347
METRIC RANK
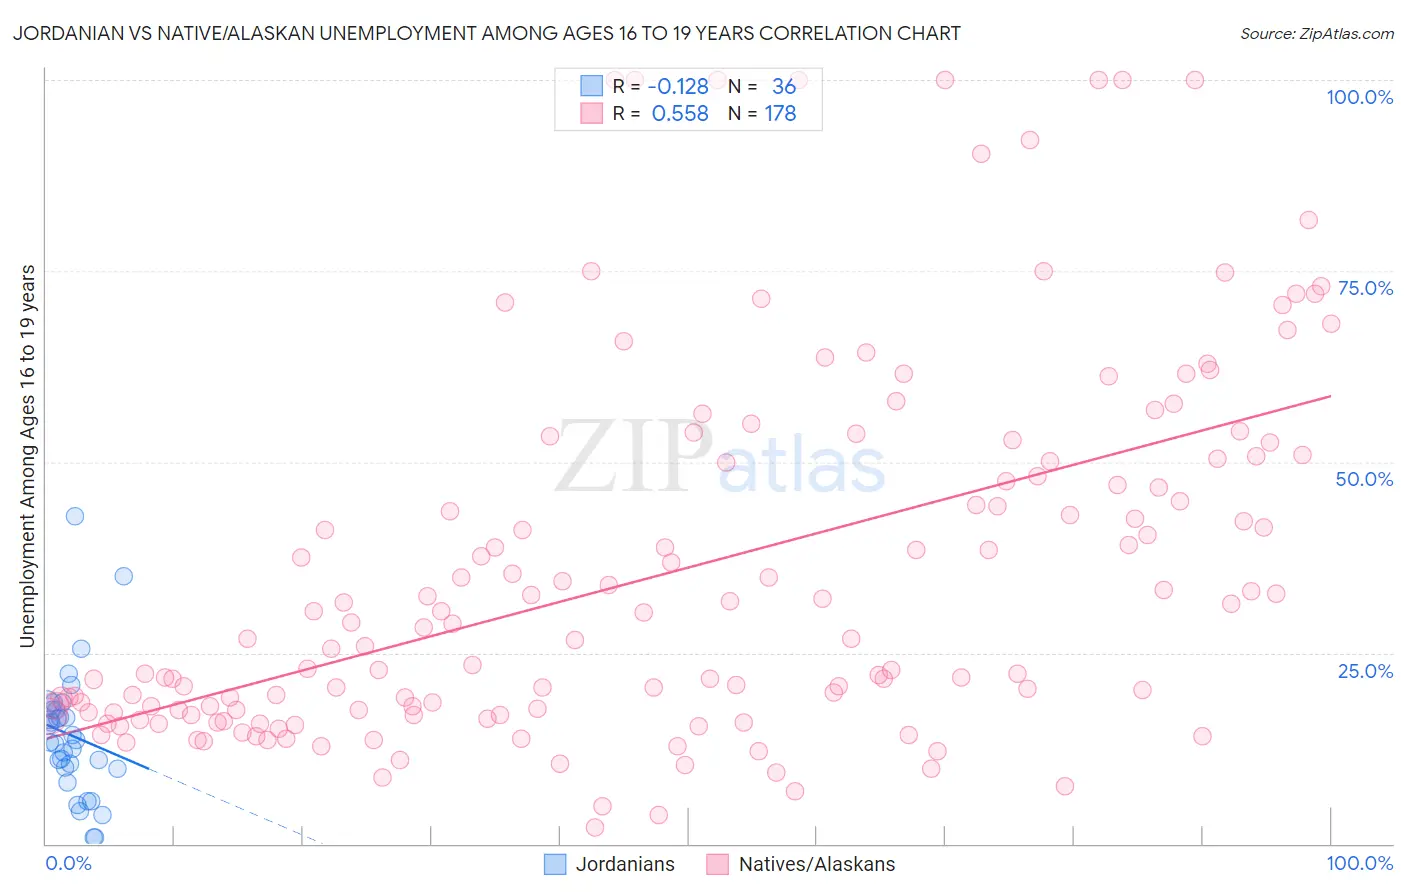
Jordanian vs Native/Alaskan Unemployment Among Ages 16 to 19 years Correlation Chart
The statistical analysis conducted on geographies consisting of 163,062,252 people shows a poor negative correlation between the proportion of Jordanians and unemployment rate among population between the ages 16 and 19 in the United States with a correlation coefficient (R) of -0.128 and weighted average of 16.0%. Similarly, the statistical analysis conducted on geographies consisting of 472,983,202 people shows a substantial positive correlation between the proportion of Natives/Alaskans and unemployment rate among population between the ages 16 and 19 in the United States with a correlation coefficient (R) of 0.558 and weighted average of 21.5%, a difference of 34.1%.
Unemployment Among Ages 16 to 19 years Correlation Summary
| Measurement | Jordanian | Native/Alaskan |
| Minimum | 0.90% | 2.2% |
| Maximum | 42.9% | 100.0% |
| Range | 42.0% | 97.8% |
| Mean | 14.2% | 35.5% |
| Median | 13.4% | 27.6% |
| Interquartile 25% (IQ1) | 9.9% | 17.3% |
| Interquartile 75% (IQ3) | 17.5% | 50.2% |
| Interquartile Range (IQR) | 7.6% | 32.9% |
| Standard Deviation (Sample) | 8.5% | 24.0% |
| Standard Deviation (Population) | 8.4% | 23.9% |
Similar Demographics by Unemployment Among Ages 16 to 19 years
Demographics Similar to Jordanians by Unemployment Among Ages 16 to 19 years
In terms of unemployment among ages 16 to 19 years, the demographic groups most similar to Jordanians are Chinese (16.0%, a difference of 0.050%), Kenyan (16.1%, a difference of 0.090%), English (16.1%, a difference of 0.14%), Immigrants from Sudan (16.0%, a difference of 0.18%), and European (16.1%, a difference of 0.54%).
| Demographics | Rating | Rank | Unemployment Among Ages 16 to 19 years |
| Immigrants | Taiwan | 100.0 /100 | #21 | Exceptional 15.8% |
| Finns | 100.0 /100 | #22 | Exceptional 15.9% |
| Belgians | 100.0 /100 | #23 | Exceptional 15.9% |
| Tongans | 100.0 /100 | #24 | Exceptional 15.9% |
| Filipinos | 100.0 /100 | #25 | Exceptional 15.9% |
| Dutch | 100.0 /100 | #26 | Exceptional 15.9% |
| Immigrants | Sudan | 99.9 /100 | #27 | Exceptional 16.0% |
| Jordanians | 99.9 /100 | #28 | Exceptional 16.0% |
| Chinese | 99.9 /100 | #29 | Exceptional 16.0% |
| Kenyans | 99.9 /100 | #30 | Exceptional 16.1% |
| English | 99.9 /100 | #31 | Exceptional 16.1% |
| Europeans | 99.9 /100 | #32 | Exceptional 16.1% |
| Immigrants | Kenya | 99.9 /100 | #33 | Exceptional 16.2% |
| Pennsylvania Germans | 99.9 /100 | #34 | Exceptional 16.2% |
| Scottish | 99.8 /100 | #35 | Exceptional 16.2% |
Demographics Similar to Natives/Alaskans by Unemployment Among Ages 16 to 19 years
In terms of unemployment among ages 16 to 19 years, the demographic groups most similar to Natives/Alaskans are Vietnamese (21.5%, a difference of 0.060%), Immigrants from Bangladesh (21.5%, a difference of 0.16%), Belizean (21.6%, a difference of 0.28%), Black/African American (21.4%, a difference of 0.54%), and Houma (21.6%, a difference of 0.54%).
| Demographics | Rating | Rank | Unemployment Among Ages 16 to 19 years |
| Immigrants | Caribbean | 0.0 /100 | #302 | Tragic 20.9% |
| Senegalese | 0.0 /100 | #303 | Tragic 21.0% |
| Aleuts | 0.0 /100 | #304 | Tragic 21.2% |
| Immigrants | Senegal | 0.0 /100 | #305 | Tragic 21.2% |
| U.S. Virgin Islanders | 0.0 /100 | #306 | Tragic 21.3% |
| Blacks/African Americans | 0.0 /100 | #307 | Tragic 21.4% |
| Immigrants | Bangladesh | 0.0 /100 | #308 | Tragic 21.5% |
| Natives/Alaskans | 0.0 /100 | #309 | Tragic 21.5% |
| Vietnamese | 0.0 /100 | #310 | Tragic 21.5% |
| Belizeans | 0.0 /100 | #311 | Tragic 21.6% |
| Houma | 0.0 /100 | #312 | Tragic 21.6% |
| Jamaicans | 0.0 /100 | #313 | Tragic 21.7% |
| Alaska Natives | 0.0 /100 | #314 | Tragic 21.8% |
| Immigrants | Dominica | 0.0 /100 | #315 | Tragic 21.9% |
| Tohono O'odham | 0.0 /100 | #316 | Tragic 22.1% |