Japanese vs Welsh Unemployment Among Seniors over 65 years
COMPARE
Japanese
Welsh
Unemployment Among Seniors over 65 years
Unemployment Among Seniors over 65 years Comparison
Japanese
Welsh
4.9%
UNEMPLOYMENT AMONG SENIORS OVER 65 YEARS
99.2/ 100
METRIC RATING
74th/ 347
METRIC RANK
5.0%
UNEMPLOYMENT AMONG SENIORS OVER 65 YEARS
99.1/ 100
METRIC RATING
76th/ 347
METRIC RANK
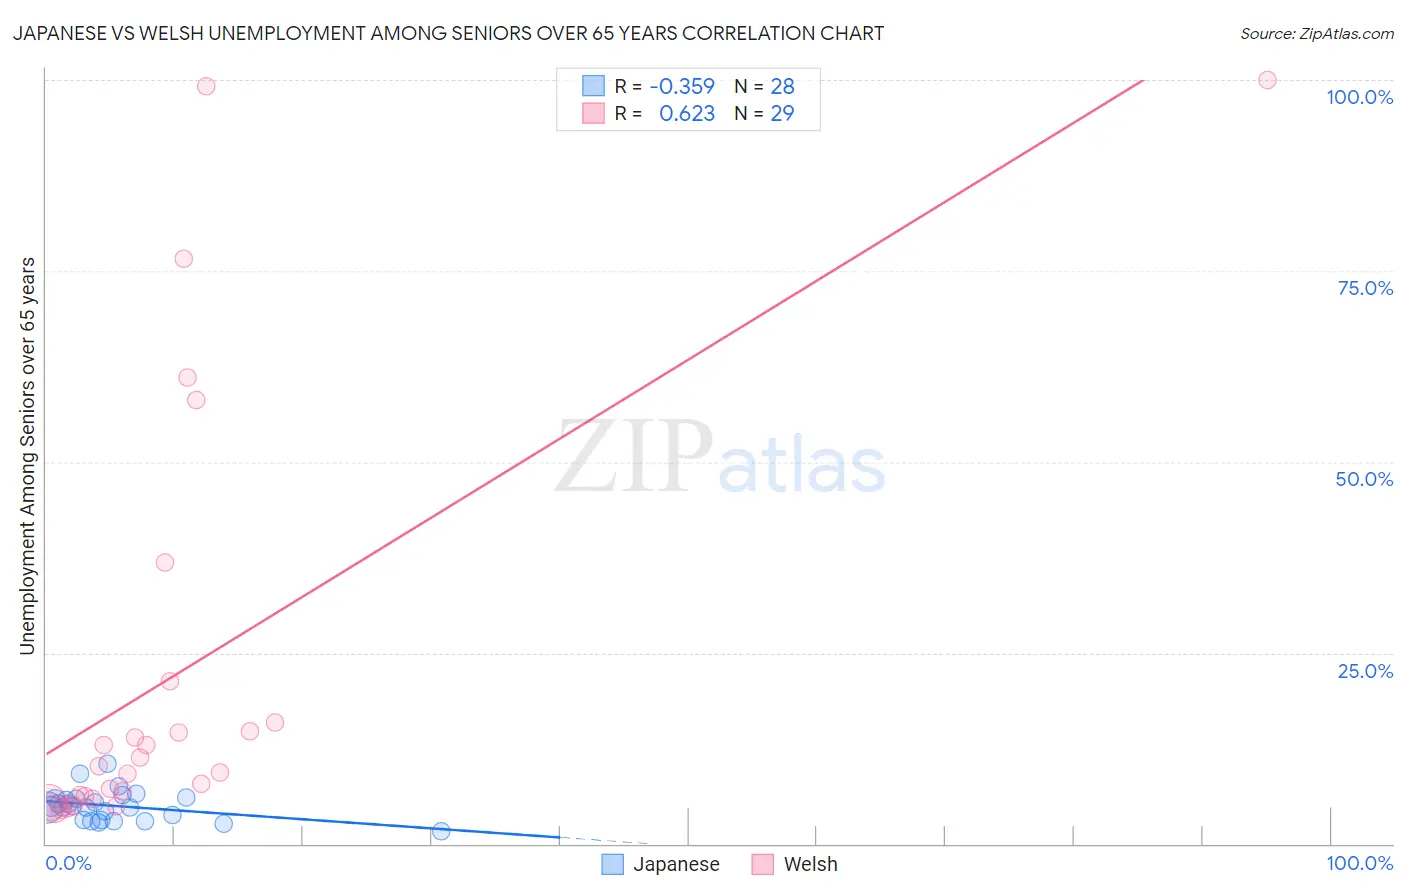
Japanese vs Welsh Unemployment Among Seniors over 65 years Correlation Chart
The statistical analysis conducted on geographies consisting of 233,832,792 people shows a mild negative correlation between the proportion of Japanese and unemployment rate amomg seniors over the age of 65 in the United States with a correlation coefficient (R) of -0.359 and weighted average of 4.9%. Similarly, the statistical analysis conducted on geographies consisting of 437,550,359 people shows a significant positive correlation between the proportion of Welsh and unemployment rate amomg seniors over the age of 65 in the United States with a correlation coefficient (R) of 0.623 and weighted average of 5.0%, a difference of 0.12%.
Unemployment Among Seniors over 65 years Correlation Summary
| Measurement | Japanese | Welsh |
| Minimum | 1.7% | 4.6% |
| Maximum | 10.5% | 100.0% |
| Range | 8.8% | 95.4% |
| Mean | 5.0% | 22.3% |
| Median | 4.9% | 10.2% |
| Interquartile 25% (IQ1) | 3.1% | 6.0% |
| Interquartile 75% (IQ3) | 5.9% | 18.6% |
| Interquartile Range (IQR) | 2.8% | 12.5% |
| Standard Deviation (Sample) | 2.0% | 28.1% |
| Standard Deviation (Population) | 1.9% | 27.7% |
Demographics Similar to Japanese and Welsh by Unemployment Among Seniors over 65 years
In terms of unemployment among seniors over 65 years, the demographic groups most similar to Japanese are Immigrants from Japan (4.9%, a difference of 0.030%), British (4.9%, a difference of 0.080%), Nicaraguan (4.9%, a difference of 0.11%), Thai (5.0%, a difference of 0.13%), and Immigrants from Moldova (4.9%, a difference of 0.26%). Similarly, the demographic groups most similar to Welsh are Thai (5.0%, a difference of 0.020%), British (4.9%, a difference of 0.040%), Immigrants from Japan (4.9%, a difference of 0.15%), Slavic (5.0%, a difference of 0.20%), and Nicaraguan (4.9%, a difference of 0.23%).
| Demographics | Rating | Rank | Unemployment Among Seniors over 65 years |
| Immigrants | Nicaragua | 99.6 /100 | #65 | Exceptional 4.9% |
| English | 99.5 /100 | #66 | Exceptional 4.9% |
| Iroquois | 99.5 /100 | #67 | Exceptional 4.9% |
| Bolivians | 99.5 /100 | #68 | Exceptional 4.9% |
| Scottish | 99.5 /100 | #69 | Exceptional 4.9% |
| Immigrants | Kazakhstan | 99.4 /100 | #70 | Exceptional 4.9% |
| Immigrants | Moldova | 99.4 /100 | #71 | Exceptional 4.9% |
| Nicaraguans | 99.3 /100 | #72 | Exceptional 4.9% |
| Immigrants | Japan | 99.2 /100 | #73 | Exceptional 4.9% |
| Japanese | 99.2 /100 | #74 | Exceptional 4.9% |
| British | 99.1 /100 | #75 | Exceptional 4.9% |
| Welsh | 99.1 /100 | #76 | Exceptional 5.0% |
| Thais | 99.1 /100 | #77 | Exceptional 5.0% |
| Slavs | 98.9 /100 | #78 | Exceptional 5.0% |
| Immigrants | Netherlands | 98.8 /100 | #79 | Exceptional 5.0% |
| Immigrants | Ethiopia | 98.6 /100 | #80 | Exceptional 5.0% |
| Estonians | 98.5 /100 | #81 | Exceptional 5.0% |
| Serbians | 98.4 /100 | #82 | Exceptional 5.0% |
| Immigrants | Zimbabwe | 98.3 /100 | #83 | Exceptional 5.0% |
| Filipinos | 98.3 /100 | #84 | Exceptional 5.0% |
| Immigrants | Hungary | 98.2 /100 | #85 | Exceptional 5.0% |