Japanese vs Cape Verdean Unemployment Among Women with Children Under 18 years
COMPARE
Japanese
Cape Verdean
Unemployment Among Women with Children Under 18 years
Unemployment Among Women with Children Under 18 years Comparison
Japanese
Cape Verdeans
5.7%
UNEMPLOYMENT AMONG WOMEN WITH CHILDREN UNDER 18 YEARS
8.7/ 100
METRIC RATING
214th/ 347
METRIC RANK
5.9%
UNEMPLOYMENT AMONG WOMEN WITH CHILDREN UNDER 18 YEARS
1.0/ 100
METRIC RATING
247th/ 347
METRIC RANK
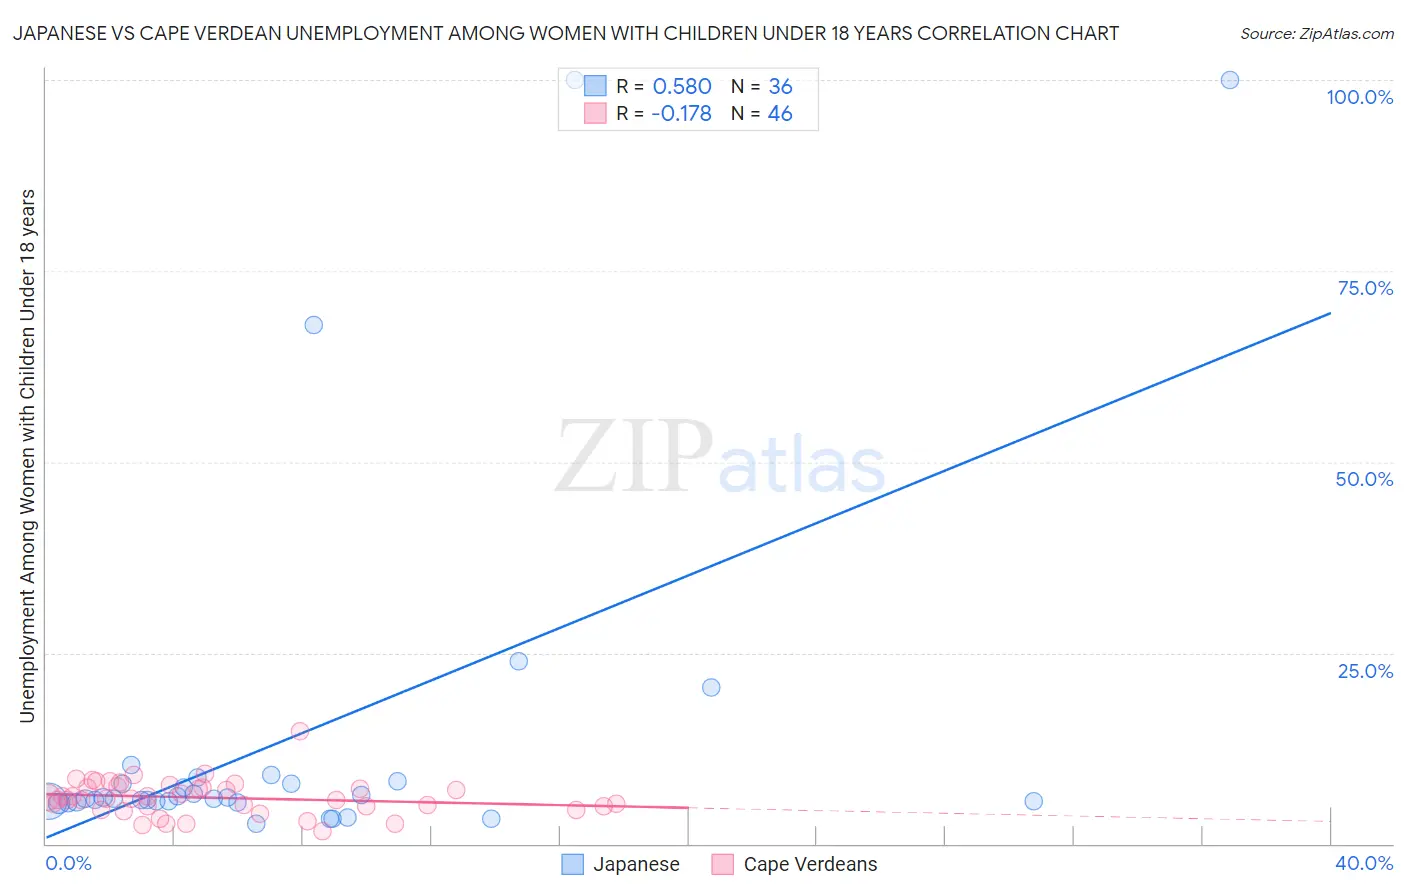
Japanese vs Cape Verdean Unemployment Among Women with Children Under 18 years Correlation Chart
The statistical analysis conducted on geographies consisting of 244,244,849 people shows a substantial positive correlation between the proportion of Japanese and unemployment rate among women with children under the age of 18 in the United States with a correlation coefficient (R) of 0.580 and weighted average of 5.7%. Similarly, the statistical analysis conducted on geographies consisting of 106,331,271 people shows a poor negative correlation between the proportion of Cape Verdeans and unemployment rate among women with children under the age of 18 in the United States with a correlation coefficient (R) of -0.178 and weighted average of 5.9%, a difference of 3.9%.
Unemployment Among Women with Children Under 18 years Correlation Summary
| Measurement | Japanese | Cape Verdean |
| Minimum | 2.6% | 1.6% |
| Maximum | 100.0% | 14.7% |
| Range | 97.4% | 13.1% |
| Mean | 13.8% | 6.0% |
| Median | 5.9% | 5.9% |
| Interquartile 25% (IQ1) | 5.5% | 4.9% |
| Interquartile 75% (IQ3) | 8.0% | 7.4% |
| Interquartile Range (IQR) | 2.6% | 2.6% |
| Standard Deviation (Sample) | 23.9% | 2.3% |
| Standard Deviation (Population) | 23.5% | 2.3% |
Similar Demographics by Unemployment Among Women with Children Under 18 years
Demographics Similar to Japanese by Unemployment Among Women with Children Under 18 years
In terms of unemployment among women with children under 18 years, the demographic groups most similar to Japanese are American (5.7%, a difference of 0.040%), Immigrants from Uganda (5.7%, a difference of 0.20%), South American (5.7%, a difference of 0.25%), Panamanian (5.7%, a difference of 0.26%), and Immigrants from Peru (5.7%, a difference of 0.30%).
| Demographics | Rating | Rank | Unemployment Among Women with Children Under 18 years |
| Peruvians | 12.1 /100 | #207 | Poor 5.6% |
| Immigrants | Costa Rica | 11.6 /100 | #208 | Poor 5.6% |
| Immigrants | Western Asia | 11.3 /100 | #209 | Poor 5.6% |
| Immigrants | Nonimmigrants | 10.6 /100 | #210 | Poor 5.7% |
| Panamanians | 10.1 /100 | #211 | Poor 5.7% |
| South Americans | 10.0 /100 | #212 | Poor 5.7% |
| Americans | 8.9 /100 | #213 | Tragic 5.7% |
| Japanese | 8.7 /100 | #214 | Tragic 5.7% |
| Immigrants | Uganda | 7.9 /100 | #215 | Tragic 5.7% |
| Immigrants | Peru | 7.4 /100 | #216 | Tragic 5.7% |
| Immigrants | Brazil | 7.1 /100 | #217 | Tragic 5.7% |
| Immigrants | Nicaragua | 7.0 /100 | #218 | Tragic 5.7% |
| Iroquois | 6.5 /100 | #219 | Tragic 5.7% |
| Immigrants | Fiji | 6.3 /100 | #220 | Tragic 5.7% |
| Pennsylvania Germans | 5.7 /100 | #221 | Tragic 5.7% |
Demographics Similar to Cape Verdeans by Unemployment Among Women with Children Under 18 years
In terms of unemployment among women with children under 18 years, the demographic groups most similar to Cape Verdeans are Uruguayan (5.9%, a difference of 0.070%), Ugandan (5.9%, a difference of 0.21%), Delaware (5.9%, a difference of 0.22%), Choctaw (5.9%, a difference of 0.25%), and Immigrants from Uruguay (5.9%, a difference of 0.29%).
| Demographics | Rating | Rank | Unemployment Among Women with Children Under 18 years |
| Immigrants | Immigrants | 2.0 /100 | #240 | Tragic 5.8% |
| Brazilians | 1.6 /100 | #241 | Tragic 5.8% |
| Moroccans | 1.4 /100 | #242 | Tragic 5.9% |
| Immigrants | Uruguay | 1.1 /100 | #243 | Tragic 5.9% |
| Choctaw | 1.1 /100 | #244 | Tragic 5.9% |
| Ugandans | 1.1 /100 | #245 | Tragic 5.9% |
| Uruguayans | 1.0 /100 | #246 | Tragic 5.9% |
| Cape Verdeans | 1.0 /100 | #247 | Tragic 5.9% |
| Delaware | 0.8 /100 | #248 | Tragic 5.9% |
| Immigrants | Cameroon | 0.8 /100 | #249 | Tragic 5.9% |
| Immigrants | Cabo Verde | 0.7 /100 | #250 | Tragic 5.9% |
| Ute | 0.7 /100 | #251 | Tragic 5.9% |
| Seminole | 0.5 /100 | #252 | Tragic 6.0% |
| Immigrants | Congo | 0.4 /100 | #253 | Tragic 6.0% |
| Immigrants | Azores | 0.3 /100 | #254 | Tragic 6.0% |