Italian vs Immigrants from Grenada Unemployment Among Ages 55 to 59 years
COMPARE
Italian
Immigrants from Grenada
Unemployment Among Ages 55 to 59 years
Unemployment Among Ages 55 to 59 years Comparison
Italians
Immigrants from Grenada
4.8%
UNEMPLOYMENT AMONG AGES 55 TO 59 YEARS
66.2/ 100
METRIC RATING
156th/ 347
METRIC RANK
5.3%
UNEMPLOYMENT AMONG AGES 55 TO 59 YEARS
0.0/ 100
METRIC RATING
293rd/ 347
METRIC RANK
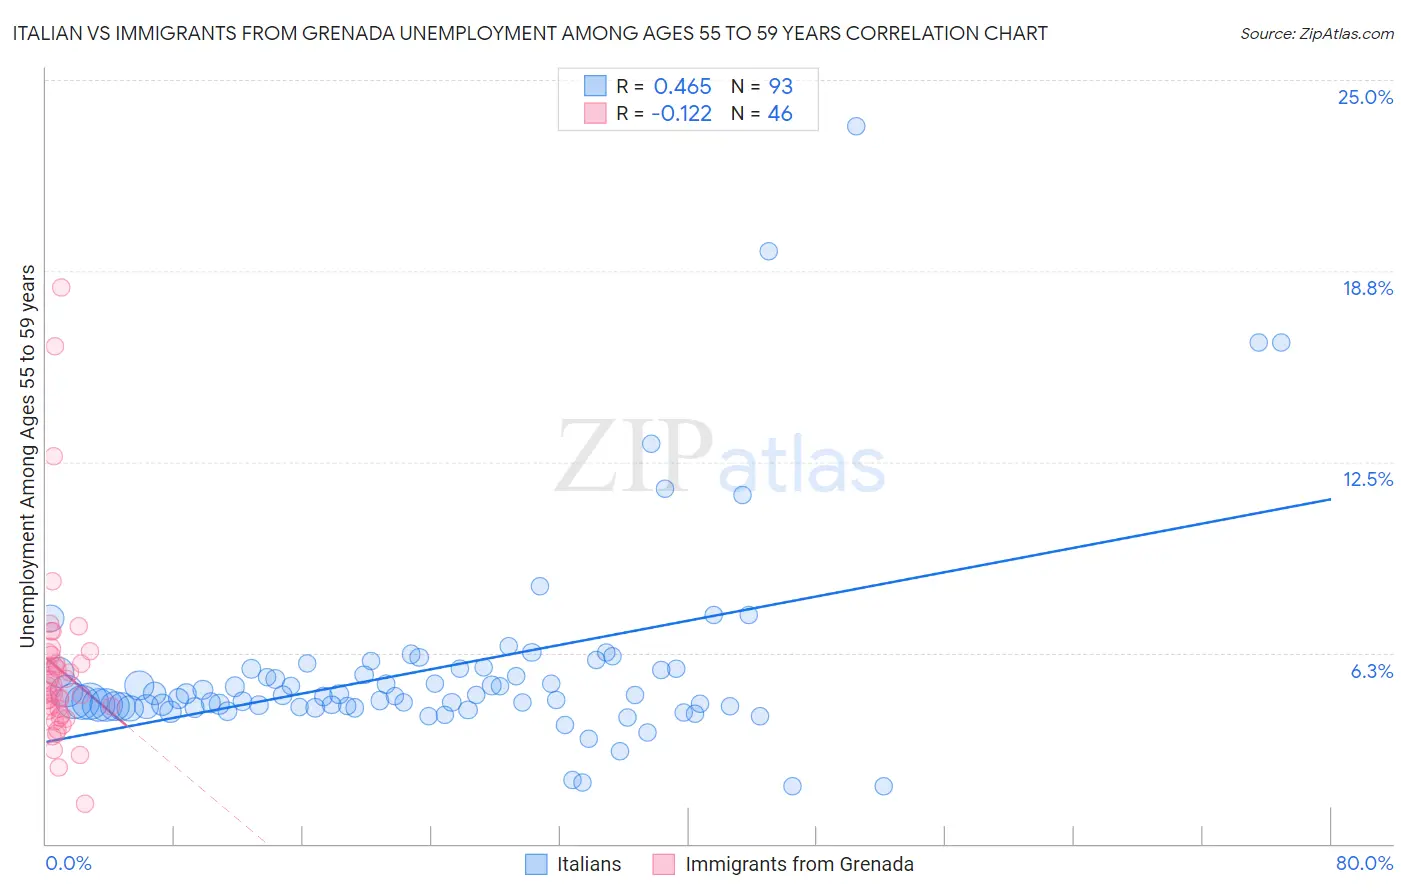
Italian vs Immigrants from Grenada Unemployment Among Ages 55 to 59 years Correlation Chart
The statistical analysis conducted on geographies consisting of 489,096,170 people shows a moderate positive correlation between the proportion of Italians and unemployment rate among population between the ages 55 and 59 in the United States with a correlation coefficient (R) of 0.465 and weighted average of 4.8%. Similarly, the statistical analysis conducted on geographies consisting of 66,232,780 people shows a poor negative correlation between the proportion of Immigrants from Grenada and unemployment rate among population between the ages 55 and 59 in the United States with a correlation coefficient (R) of -0.122 and weighted average of 5.3%, a difference of 11.2%.
Unemployment Among Ages 55 to 59 years Correlation Summary
| Measurement | Italian | Immigrants from Grenada |
| Minimum | 1.9% | 1.3% |
| Maximum | 23.5% | 18.2% |
| Range | 21.6% | 16.9% |
| Mean | 5.7% | 5.7% |
| Median | 4.8% | 5.0% |
| Interquartile 25% (IQ1) | 4.5% | 4.2% |
| Interquartile 75% (IQ3) | 5.7% | 6.2% |
| Interquartile Range (IQR) | 1.2% | 2.0% |
| Standard Deviation (Sample) | 3.3% | 3.0% |
| Standard Deviation (Population) | 3.3% | 3.0% |
Similar Demographics by Unemployment Among Ages 55 to 59 years
Demographics Similar to Italians by Unemployment Among Ages 55 to 59 years
In terms of unemployment among ages 55 to 59 years, the demographic groups most similar to Italians are Immigrants from North Macedonia (4.8%, a difference of 0.0%), Carpatho Rusyn (4.8%, a difference of 0.010%), Immigrants from Panama (4.8%, a difference of 0.030%), Slovak (4.8%, a difference of 0.040%), and Immigrants from Uruguay (4.8%, a difference of 0.050%).
| Demographics | Rating | Rank | Unemployment Among Ages 55 to 59 years |
| Immigrants | Lithuania | 70.8 /100 | #149 | Good 4.8% |
| Immigrants | Northern Africa | 69.8 /100 | #150 | Good 4.8% |
| Bahamians | 68.6 /100 | #151 | Good 4.8% |
| Laotians | 68.2 /100 | #152 | Good 4.8% |
| Immigrants | Uruguay | 67.2 /100 | #153 | Good 4.8% |
| Immigrants | Panama | 66.8 /100 | #154 | Good 4.8% |
| Immigrants | North Macedonia | 66.3 /100 | #155 | Good 4.8% |
| Italians | 66.2 /100 | #156 | Good 4.8% |
| Carpatho Rusyns | 66.0 /100 | #157 | Good 4.8% |
| Slovaks | 65.3 /100 | #158 | Good 4.8% |
| Immigrants | Nicaragua | 65.2 /100 | #159 | Good 4.8% |
| Chickasaw | 65.1 /100 | #160 | Good 4.8% |
| Koreans | 64.6 /100 | #161 | Good 4.8% |
| Immigrants | Africa | 64.2 /100 | #162 | Good 4.8% |
| Immigrants | Lebanon | 63.8 /100 | #163 | Good 4.8% |
Demographics Similar to Immigrants from Grenada by Unemployment Among Ages 55 to 59 years
In terms of unemployment among ages 55 to 59 years, the demographic groups most similar to Immigrants from Grenada are Cajun (5.3%, a difference of 0.12%), British West Indian (5.3%, a difference of 0.19%), Dutch West Indian (5.3%, a difference of 0.24%), Barbadian (5.3%, a difference of 0.28%), and Trinidadian and Tobagonian (5.3%, a difference of 0.33%).
| Demographics | Rating | Rank | Unemployment Among Ages 55 to 59 years |
| Immigrants | Ghana | 0.0 /100 | #286 | Tragic 5.3% |
| Immigrants | Guatemala | 0.0 /100 | #287 | Tragic 5.3% |
| Immigrants | Israel | 0.0 /100 | #288 | Tragic 5.3% |
| Immigrants | Central America | 0.0 /100 | #289 | Tragic 5.3% |
| Sioux | 0.0 /100 | #290 | Tragic 5.3% |
| Trinidadians and Tobagonians | 0.0 /100 | #291 | Tragic 5.3% |
| British West Indians | 0.0 /100 | #292 | Tragic 5.3% |
| Immigrants | Grenada | 0.0 /100 | #293 | Tragic 5.3% |
| Cajuns | 0.0 /100 | #294 | Tragic 5.3% |
| Dutch West Indians | 0.0 /100 | #295 | Tragic 5.3% |
| Barbadians | 0.0 /100 | #296 | Tragic 5.3% |
| Immigrants | Mexico | 0.0 /100 | #297 | Tragic 5.3% |
| Hispanics or Latinos | 0.0 /100 | #298 | Tragic 5.4% |
| Cape Verdeans | 0.0 /100 | #299 | Tragic 5.4% |
| Immigrants | St. Vincent and the Grenadines | 0.0 /100 | #300 | Tragic 5.4% |