Israeli vs Korean Unemployment Among Ages 20 to 24 years
COMPARE
Israeli
Korean
Unemployment Among Ages 20 to 24 years
Unemployment Among Ages 20 to 24 years Comparison
Israelis
Koreans
10.6%
UNEMPLOYMENT AMONG AGES 20 TO 24 YEARS
3.7/ 100
METRIC RATING
232nd/ 347
METRIC RANK
10.3%
UNEMPLOYMENT AMONG AGES 20 TO 24 YEARS
51.9/ 100
METRIC RATING
172nd/ 347
METRIC RANK
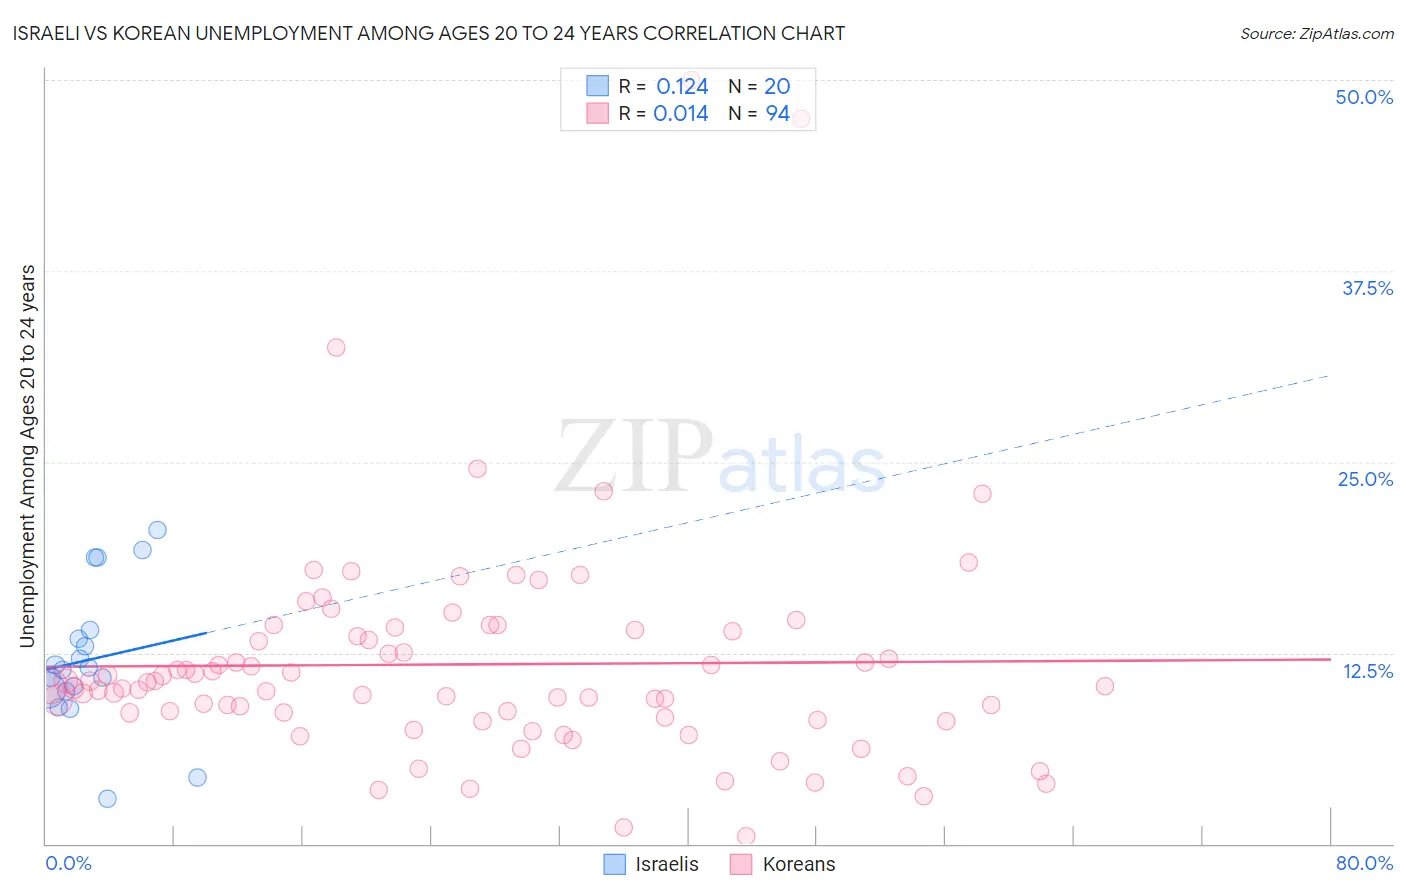
Israeli vs Korean Unemployment Among Ages 20 to 24 years Correlation Chart
The statistical analysis conducted on geographies consisting of 208,194,811 people shows a poor positive correlation between the proportion of Israelis and unemployment rate among population between the ages 20 and 24 in the United States with a correlation coefficient (R) of 0.124 and weighted average of 10.6%. Similarly, the statistical analysis conducted on geographies consisting of 484,932,866 people shows no correlation between the proportion of Koreans and unemployment rate among population between the ages 20 and 24 in the United States with a correlation coefficient (R) of 0.014 and weighted average of 10.3%, a difference of 3.1%.
Unemployment Among Ages 20 to 24 years Correlation Summary
| Measurement | Israeli | Korean |
| Minimum | 3.0% | 0.50% |
| Maximum | 20.5% | 50.0% |
| Range | 17.5% | 49.5% |
| Mean | 12.1% | 11.7% |
| Median | 11.4% | 10.3% |
| Interquartile 25% (IQ1) | 10.0% | 8.3% |
| Interquartile 75% (IQ3) | 13.7% | 13.9% |
| Interquartile Range (IQR) | 3.7% | 5.6% |
| Standard Deviation (Sample) | 4.6% | 7.4% |
| Standard Deviation (Population) | 4.4% | 7.4% |
Similar Demographics by Unemployment Among Ages 20 to 24 years
Demographics Similar to Israelis by Unemployment Among Ages 20 to 24 years
In terms of unemployment among ages 20 to 24 years, the demographic groups most similar to Israelis are Choctaw (10.6%, a difference of 0.020%), Immigrants from Africa (10.6%, a difference of 0.040%), Native Hawaiian (10.6%, a difference of 0.060%), Immigrants from Ukraine (10.6%, a difference of 0.090%), and French American Indian (10.6%, a difference of 0.11%).
| Demographics | Rating | Rank | Unemployment Among Ages 20 to 24 years |
| Immigrants | South America | 5.1 /100 | #225 | Tragic 10.6% |
| Immigrants | Costa Rica | 4.9 /100 | #226 | Tragic 10.6% |
| Palestinians | 4.9 /100 | #227 | Tragic 10.6% |
| Mexican American Indians | 4.6 /100 | #228 | Tragic 10.6% |
| Americans | 4.4 /100 | #229 | Tragic 10.6% |
| French American Indians | 4.1 /100 | #230 | Tragic 10.6% |
| Native Hawaiians | 3.9 /100 | #231 | Tragic 10.6% |
| Israelis | 3.7 /100 | #232 | Tragic 10.6% |
| Choctaw | 3.6 /100 | #233 | Tragic 10.6% |
| Immigrants | Africa | 3.5 /100 | #234 | Tragic 10.6% |
| Immigrants | Ukraine | 3.3 /100 | #235 | Tragic 10.6% |
| Mexicans | 3.2 /100 | #236 | Tragic 10.6% |
| Immigrants | Immigrants | 2.7 /100 | #237 | Tragic 10.6% |
| Immigrants | Pakistan | 2.6 /100 | #238 | Tragic 10.6% |
| Salvadorans | 2.4 /100 | #239 | Tragic 10.7% |
Demographics Similar to Koreans by Unemployment Among Ages 20 to 24 years
In terms of unemployment among ages 20 to 24 years, the demographic groups most similar to Koreans are Immigrants from Eastern Asia (10.3%, a difference of 0.030%), Immigrants from Sweden (10.3%, a difference of 0.040%), Ukrainian (10.3%, a difference of 0.070%), Turkish (10.3%, a difference of 0.12%), and Immigrants from Colombia (10.3%, a difference of 0.16%).
| Demographics | Rating | Rank | Unemployment Among Ages 20 to 24 years |
| Lebanese | 58.3 /100 | #165 | Average 10.3% |
| Italians | 57.7 /100 | #166 | Average 10.3% |
| Immigrants | Fiji | 57.6 /100 | #167 | Average 10.3% |
| Iraqis | 56.7 /100 | #168 | Average 10.3% |
| Immigrants | Colombia | 56.3 /100 | #169 | Average 10.3% |
| Turks | 55.2 /100 | #170 | Average 10.3% |
| Immigrants | Eastern Asia | 52.7 /100 | #171 | Average 10.3% |
| Koreans | 51.9 /100 | #172 | Average 10.3% |
| Immigrants | Sweden | 50.8 /100 | #173 | Average 10.3% |
| Ukrainians | 50.0 /100 | #174 | Average 10.3% |
| Samoans | 45.4 /100 | #175 | Average 10.3% |
| Potawatomi | 42.0 /100 | #176 | Average 10.3% |
| Immigrants | Czechoslovakia | 40.8 /100 | #177 | Average 10.3% |
| Alsatians | 40.5 /100 | #178 | Average 10.3% |
| Tlingit-Haida | 39.7 /100 | #179 | Fair 10.3% |