Israeli vs Immigrants from Egypt Unemployment Among Ages 55 to 59 years
COMPARE
Israeli
Immigrants from Egypt
Unemployment Among Ages 55 to 59 years
Unemployment Among Ages 55 to 59 years Comparison
Israelis
Immigrants from Egypt
5.2%
UNEMPLOYMENT AMONG AGES 55 TO 59 YEARS
0.0/ 100
METRIC RATING
275th/ 347
METRIC RANK
4.7%
UNEMPLOYMENT AMONG AGES 55 TO 59 YEARS
93.5/ 100
METRIC RATING
107th/ 347
METRIC RANK
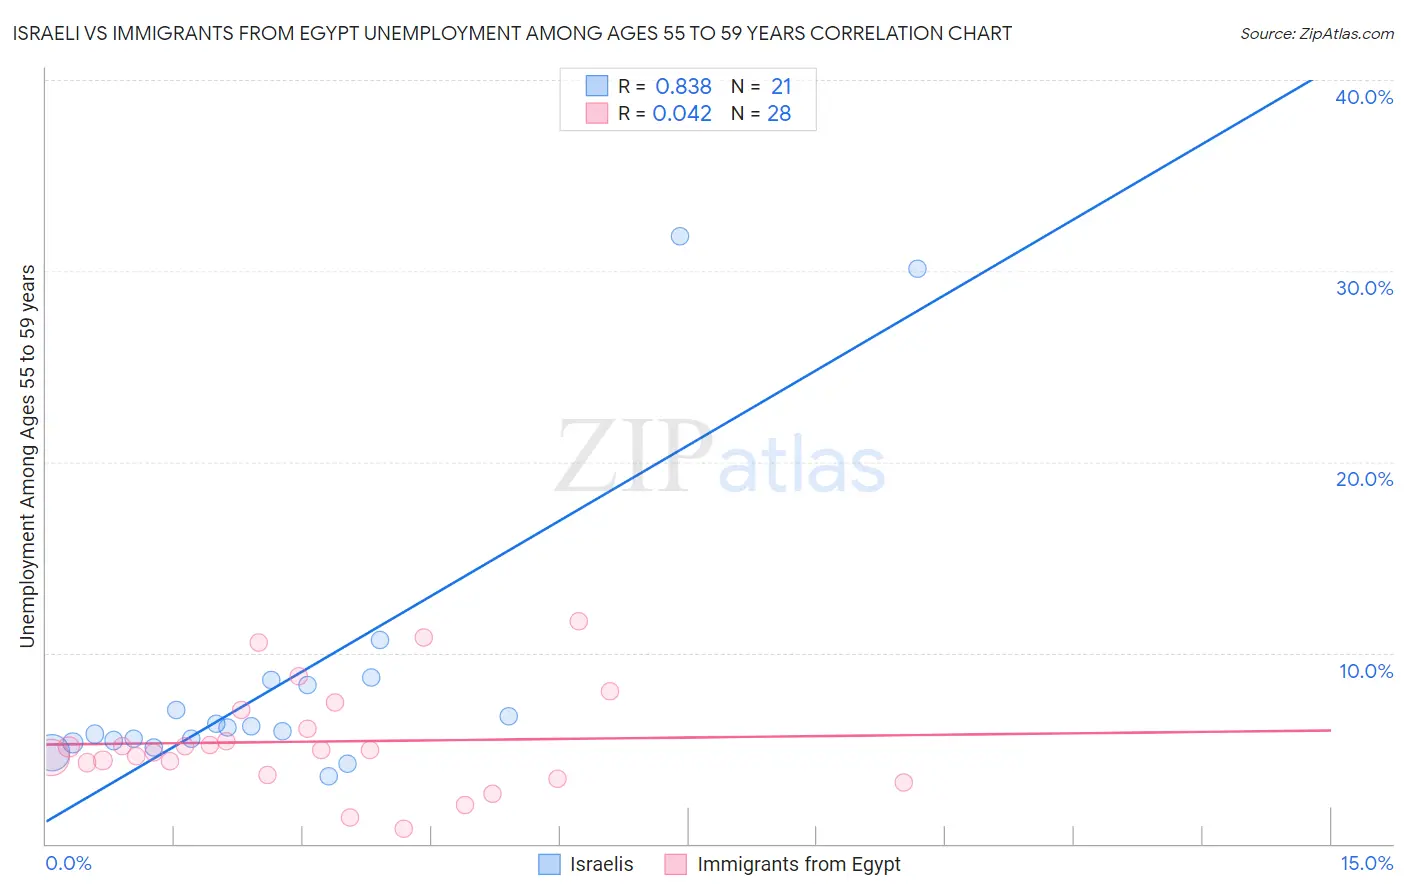
Israeli vs Immigrants from Egypt Unemployment Among Ages 55 to 59 years Correlation Chart
The statistical analysis conducted on geographies consisting of 203,700,467 people shows a very strong positive correlation between the proportion of Israelis and unemployment rate among population between the ages 55 and 59 in the United States with a correlation coefficient (R) of 0.838 and weighted average of 5.2%. Similarly, the statistical analysis conducted on geographies consisting of 236,678,823 people shows no correlation between the proportion of Immigrants from Egypt and unemployment rate among population between the ages 55 and 59 in the United States with a correlation coefficient (R) of 0.042 and weighted average of 4.7%, a difference of 11.4%.
Unemployment Among Ages 55 to 59 years Correlation Summary
| Measurement | Israeli | Immigrants from Egypt |
| Minimum | 3.5% | 0.80% |
| Maximum | 31.8% | 11.6% |
| Range | 28.3% | 10.8% |
| Mean | 8.6% | 5.3% |
| Median | 6.1% | 4.9% |
| Interquartile 25% (IQ1) | 5.3% | 3.9% |
| Interquartile 75% (IQ3) | 8.4% | 6.5% |
| Interquartile Range (IQR) | 3.1% | 2.6% |
| Standard Deviation (Sample) | 7.6% | 2.7% |
| Standard Deviation (Population) | 7.4% | 2.6% |
Similar Demographics by Unemployment Among Ages 55 to 59 years
Demographics Similar to Israelis by Unemployment Among Ages 55 to 59 years
In terms of unemployment among ages 55 to 59 years, the demographic groups most similar to Israelis are West Indian (5.2%, a difference of 0.010%), Mexican American Indian (5.2%, a difference of 0.10%), Immigrants from Latin America (5.2%, a difference of 0.13%), Ottawa (5.2%, a difference of 0.22%), and Immigrants from Barbados (5.2%, a difference of 0.31%).
| Demographics | Rating | Rank | Unemployment Among Ages 55 to 59 years |
| Mexicans | 0.1 /100 | #268 | Tragic 5.2% |
| Tsimshian | 0.1 /100 | #269 | Tragic 5.2% |
| Ute | 0.1 /100 | #270 | Tragic 5.2% |
| Cree | 0.1 /100 | #271 | Tragic 5.2% |
| Immigrants | Jamaica | 0.0 /100 | #272 | Tragic 5.2% |
| Ottawa | 0.0 /100 | #273 | Tragic 5.2% |
| Mexican American Indians | 0.0 /100 | #274 | Tragic 5.2% |
| Israelis | 0.0 /100 | #275 | Tragic 5.2% |
| West Indians | 0.0 /100 | #276 | Tragic 5.2% |
| Immigrants | Latin America | 0.0 /100 | #277 | Tragic 5.2% |
| Immigrants | Barbados | 0.0 /100 | #278 | Tragic 5.2% |
| Alsatians | 0.0 /100 | #279 | Tragic 5.2% |
| Immigrants | Uzbekistan | 0.0 /100 | #280 | Tragic 5.3% |
| Guatemalans | 0.0 /100 | #281 | Tragic 5.3% |
| Immigrants | Trinidad and Tobago | 0.0 /100 | #282 | Tragic 5.3% |
Demographics Similar to Immigrants from Egypt by Unemployment Among Ages 55 to 59 years
In terms of unemployment among ages 55 to 59 years, the demographic groups most similar to Immigrants from Egypt are French (4.7%, a difference of 0.040%), Chilean (4.7%, a difference of 0.050%), Immigrants from Laos (4.7%, a difference of 0.060%), Immigrants from North America (4.7%, a difference of 0.070%), and Immigrants from Turkey (4.7%, a difference of 0.080%).
| Demographics | Rating | Rank | Unemployment Among Ages 55 to 59 years |
| Serbians | 94.4 /100 | #100 | Exceptional 4.7% |
| Celtics | 94.3 /100 | #101 | Exceptional 4.7% |
| Canadians | 94.1 /100 | #102 | Exceptional 4.7% |
| Immigrants | Oceania | 94.0 /100 | #103 | Exceptional 4.7% |
| Immigrants | Turkey | 93.9 /100 | #104 | Exceptional 4.7% |
| Immigrants | North America | 93.9 /100 | #105 | Exceptional 4.7% |
| Immigrants | Laos | 93.9 /100 | #106 | Exceptional 4.7% |
| Immigrants | Egypt | 93.5 /100 | #107 | Exceptional 4.7% |
| French | 93.3 /100 | #108 | Exceptional 4.7% |
| Chileans | 93.2 /100 | #109 | Exceptional 4.7% |
| Egyptians | 92.9 /100 | #110 | Exceptional 4.7% |
| Austrians | 92.4 /100 | #111 | Exceptional 4.7% |
| Afghans | 92.1 /100 | #112 | Exceptional 4.7% |
| Immigrants | Spain | 91.4 /100 | #113 | Exceptional 4.7% |
| Bangladeshis | 91.3 /100 | #114 | Exceptional 4.7% |