Iroquois vs Immigrants from Portugal Unemployment Among Ages 55 to 59 years
COMPARE
Iroquois
Immigrants from Portugal
Unemployment Among Ages 55 to 59 years
Unemployment Among Ages 55 to 59 years Comparison
Iroquois
Immigrants from Portugal
4.9%
UNEMPLOYMENT AMONG AGES 55 TO 59 YEARS
34.5/ 100
METRIC RATING
189th/ 347
METRIC RANK
5.5%
UNEMPLOYMENT AMONG AGES 55 TO 59 YEARS
0.0/ 100
METRIC RATING
305th/ 347
METRIC RANK
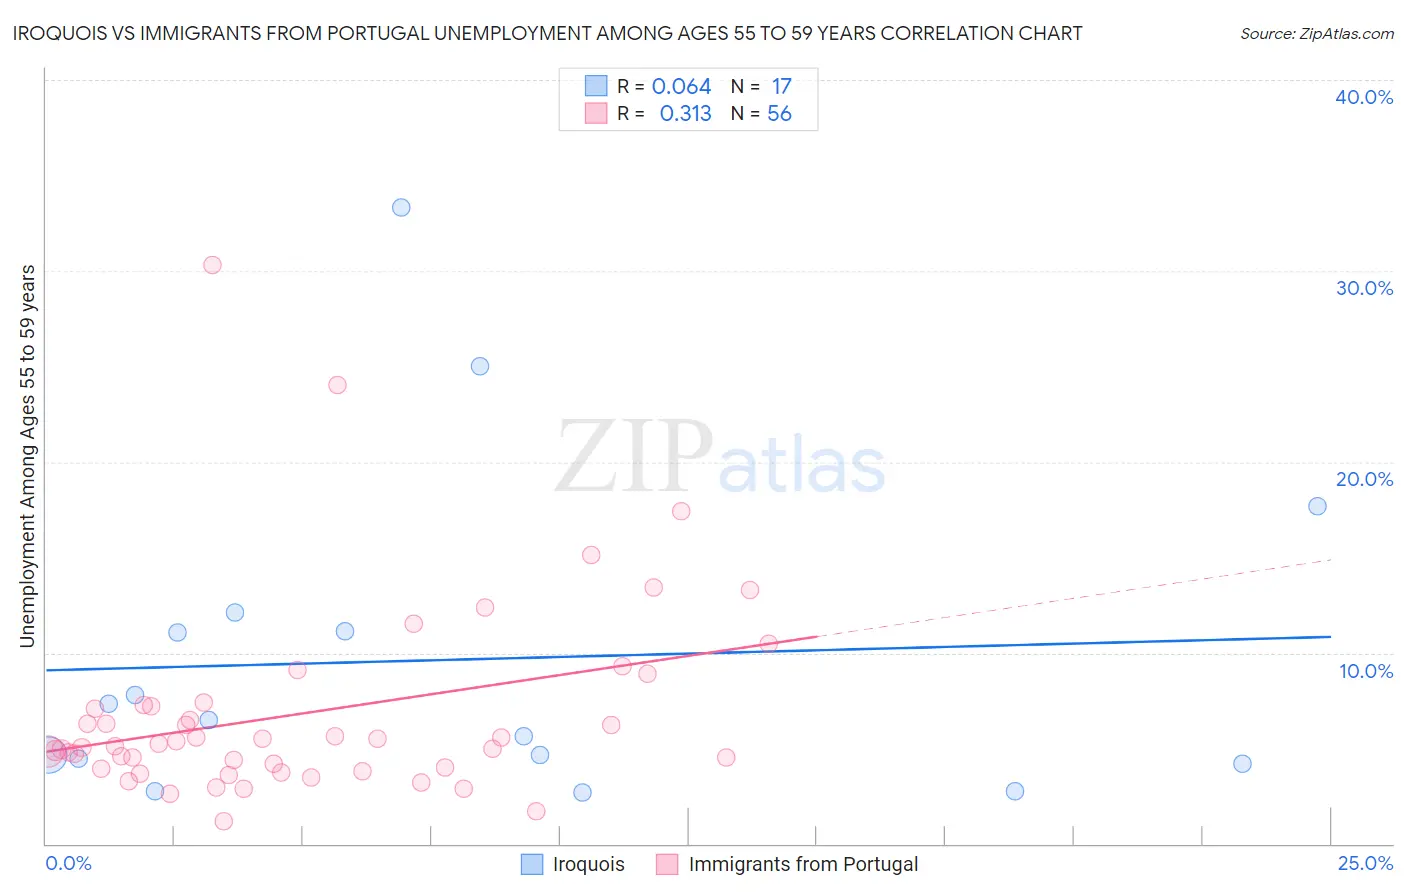
Iroquois vs Immigrants from Portugal Unemployment Among Ages 55 to 59 years Correlation Chart
The statistical analysis conducted on geographies consisting of 196,606,157 people shows a slight positive correlation between the proportion of Iroquois and unemployment rate among population between the ages 55 and 59 in the United States with a correlation coefficient (R) of 0.064 and weighted average of 4.9%. Similarly, the statistical analysis conducted on geographies consisting of 169,423,792 people shows a mild positive correlation between the proportion of Immigrants from Portugal and unemployment rate among population between the ages 55 and 59 in the United States with a correlation coefficient (R) of 0.313 and weighted average of 5.5%, a difference of 13.6%.
Unemployment Among Ages 55 to 59 years Correlation Summary
| Measurement | Iroquois | Immigrants from Portugal |
| Minimum | 2.7% | 1.2% |
| Maximum | 33.3% | 30.3% |
| Range | 30.6% | 29.1% |
| Mean | 9.6% | 6.8% |
| Median | 6.5% | 5.2% |
| Interquartile 25% (IQ1) | 4.3% | 4.0% |
| Interquartile 75% (IQ3) | 11.6% | 7.2% |
| Interquartile Range (IQR) | 7.3% | 3.3% |
| Standard Deviation (Sample) | 8.5% | 5.2% |
| Standard Deviation (Population) | 8.2% | 5.1% |
Similar Demographics by Unemployment Among Ages 55 to 59 years
Demographics Similar to Iroquois by Unemployment Among Ages 55 to 59 years
In terms of unemployment among ages 55 to 59 years, the demographic groups most similar to Iroquois are Russian (4.9%, a difference of 0.030%), Immigrants from Eastern Asia (4.8%, a difference of 0.070%), Immigrants from Morocco (4.8%, a difference of 0.090%), Iranian (4.9%, a difference of 0.090%), and Peruvian (4.8%, a difference of 0.11%).
| Demographics | Rating | Rank | Unemployment Among Ages 55 to 59 years |
| Immigrants | Europe | 40.4 /100 | #182 | Average 4.8% |
| Immigrants | Peru | 38.6 /100 | #183 | Fair 4.8% |
| Immigrants | Czechoslovakia | 38.0 /100 | #184 | Fair 4.8% |
| Peruvians | 37.0 /100 | #185 | Fair 4.8% |
| Osage | 37.0 /100 | #186 | Fair 4.8% |
| Immigrants | Morocco | 36.5 /100 | #187 | Fair 4.8% |
| Immigrants | Eastern Asia | 36.1 /100 | #188 | Fair 4.8% |
| Iroquois | 34.5 /100 | #189 | Fair 4.9% |
| Russians | 33.9 /100 | #190 | Fair 4.9% |
| Iranians | 32.4 /100 | #191 | Fair 4.9% |
| Immigrants | Ukraine | 31.7 /100 | #192 | Fair 4.9% |
| Immigrants | Italy | 30.1 /100 | #193 | Fair 4.9% |
| Spaniards | 27.2 /100 | #194 | Fair 4.9% |
| Estonians | 27.2 /100 | #195 | Fair 4.9% |
| Eastern Europeans | 26.7 /100 | #196 | Fair 4.9% |
Demographics Similar to Immigrants from Portugal by Unemployment Among Ages 55 to 59 years
In terms of unemployment among ages 55 to 59 years, the demographic groups most similar to Immigrants from Portugal are Immigrants from Cabo Verde (5.5%, a difference of 0.12%), Black/African American (5.5%, a difference of 0.17%), Immigrants from Belize (5.5%, a difference of 0.34%), Sierra Leonean (5.5%, a difference of 0.70%), and Marshallese (5.5%, a difference of 0.70%).
| Demographics | Rating | Rank | Unemployment Among Ages 55 to 59 years |
| Hispanics or Latinos | 0.0 /100 | #298 | Tragic 5.4% |
| Cape Verdeans | 0.0 /100 | #299 | Tragic 5.4% |
| Immigrants | St. Vincent and the Grenadines | 0.0 /100 | #300 | Tragic 5.4% |
| Immigrants | Dominica | 0.0 /100 | #301 | Tragic 5.5% |
| Sierra Leoneans | 0.0 /100 | #302 | Tragic 5.5% |
| Marshallese | 0.0 /100 | #303 | Tragic 5.5% |
| Blacks/African Americans | 0.0 /100 | #304 | Tragic 5.5% |
| Immigrants | Portugal | 0.0 /100 | #305 | Tragic 5.5% |
| Immigrants | Cabo Verde | 0.0 /100 | #306 | Tragic 5.5% |
| Immigrants | Belize | 0.0 /100 | #307 | Tragic 5.5% |
| Spanish American Indians | 0.0 /100 | #308 | Tragic 5.6% |
| Nepalese | 0.0 /100 | #309 | Tragic 5.6% |
| Belizeans | 0.0 /100 | #310 | Tragic 5.6% |
| Houma | 0.0 /100 | #311 | Tragic 5.6% |
| Ecuadorians | 0.0 /100 | #312 | Tragic 5.6% |