Iroquois vs Immigrants from England Female Unemployment
COMPARE
Iroquois
Immigrants from England
Female Unemployment
Female Unemployment Comparison
Iroquois
Immigrants from England
5.4%
FEMALE UNEMPLOYMENT
20.8/ 100
METRIC RATING
202nd/ 347
METRIC RANK
5.0%
FEMALE UNEMPLOYMENT
93.6/ 100
METRIC RATING
105th/ 347
METRIC RANK
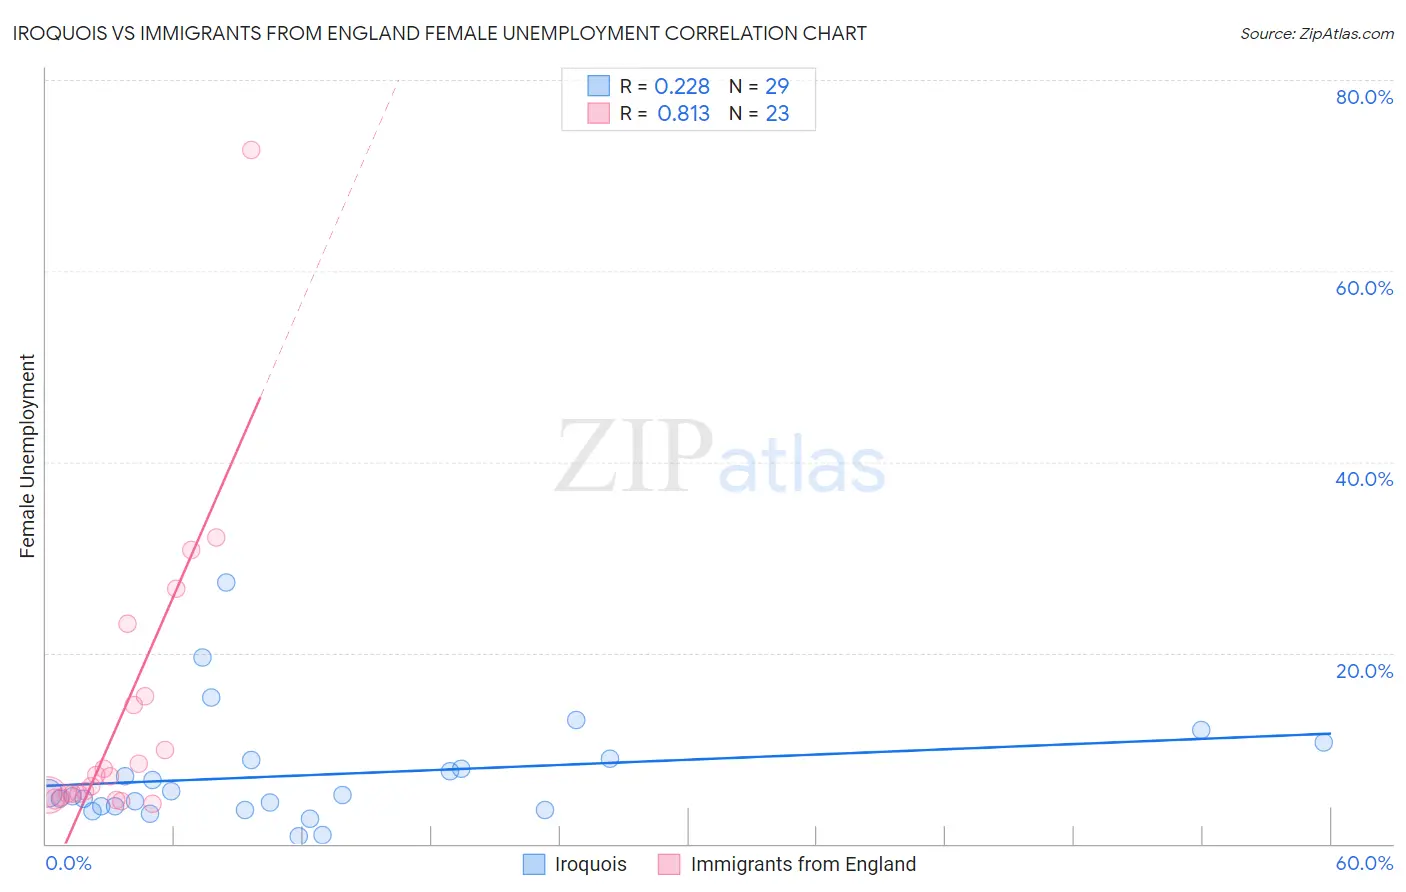
Iroquois vs Immigrants from England Female Unemployment Correlation Chart
The statistical analysis conducted on geographies consisting of 206,447,446 people shows a weak positive correlation between the proportion of Iroquois and unemploymnet rate among females in the United States with a correlation coefficient (R) of 0.228 and weighted average of 5.4%. Similarly, the statistical analysis conducted on geographies consisting of 389,797,734 people shows a very strong positive correlation between the proportion of Immigrants from England and unemploymnet rate among females in the United States with a correlation coefficient (R) of 0.813 and weighted average of 5.0%, a difference of 6.3%.
Female Unemployment Correlation Summary
| Measurement | Iroquois | Immigrants from England |
| Minimum | 0.80% | 4.2% |
| Maximum | 27.3% | 72.7% |
| Range | 26.5% | 68.5% |
| Mean | 7.2% | 13.5% |
| Median | 5.1% | 7.1% |
| Interquartile 25% (IQ1) | 3.7% | 5.1% |
| Interquartile 75% (IQ3) | 8.8% | 15.4% |
| Interquartile Range (IQR) | 5.1% | 10.3% |
| Standard Deviation (Sample) | 5.7% | 15.6% |
| Standard Deviation (Population) | 5.6% | 15.3% |
Similar Demographics by Female Unemployment
Demographics Similar to Iroquois by Female Unemployment
In terms of female unemployment, the demographic groups most similar to Iroquois are Immigrants from Middle Africa (5.4%, a difference of 0.0%), Immigrants from South Eastern Asia (5.4%, a difference of 0.040%), Soviet Union (5.4%, a difference of 0.080%), Immigrants from Israel (5.4%, a difference of 0.10%), and Hawaiian (5.4%, a difference of 0.12%).
| Demographics | Rating | Rank | Female Unemployment |
| Immigrants | Colombia | 26.2 /100 | #195 | Fair 5.3% |
| Spaniards | 25.2 /100 | #196 | Fair 5.3% |
| Alsatians | 23.9 /100 | #197 | Fair 5.3% |
| Tsimshian | 23.1 /100 | #198 | Fair 5.4% |
| Hawaiians | 22.2 /100 | #199 | Fair 5.4% |
| Soviet Union | 21.7 /100 | #200 | Fair 5.4% |
| Immigrants | Middle Africa | 20.8 /100 | #201 | Fair 5.4% |
| Iroquois | 20.8 /100 | #202 | Fair 5.4% |
| Immigrants | South Eastern Asia | 20.3 /100 | #203 | Fair 5.4% |
| Immigrants | Israel | 19.7 /100 | #204 | Poor 5.4% |
| Immigrants | Afghanistan | 18.9 /100 | #205 | Poor 5.4% |
| Immigrants | Brazil | 18.8 /100 | #206 | Poor 5.4% |
| Creek | 15.4 /100 | #207 | Poor 5.4% |
| Immigrants | Costa Rica | 13.7 /100 | #208 | Poor 5.4% |
| Koreans | 13.4 /100 | #209 | Poor 5.4% |
Demographics Similar to Immigrants from England by Female Unemployment
In terms of female unemployment, the demographic groups most similar to Immigrants from England are Kenyan (5.0%, a difference of 0.020%), Paraguayan (5.1%, a difference of 0.090%), Immigrants from Switzerland (5.1%, a difference of 0.12%), Puget Sound Salish (5.1%, a difference of 0.14%), and Immigrants from Eastern Africa (5.1%, a difference of 0.19%).
| Demographics | Rating | Rank | Female Unemployment |
| Immigrants | Kuwait | 95.2 /100 | #98 | Exceptional 5.0% |
| Immigrants | Zaire | 95.2 /100 | #99 | Exceptional 5.0% |
| Indonesians | 95.1 /100 | #100 | Exceptional 5.0% |
| Immigrants | Czechoslovakia | 95.0 /100 | #101 | Exceptional 5.0% |
| Immigrants | Kenya | 94.8 /100 | #102 | Exceptional 5.0% |
| Somalis | 94.6 /100 | #103 | Exceptional 5.0% |
| Kenyans | 93.7 /100 | #104 | Exceptional 5.0% |
| Immigrants | England | 93.6 /100 | #105 | Exceptional 5.0% |
| Paraguayans | 93.2 /100 | #106 | Exceptional 5.1% |
| Immigrants | Switzerland | 93.1 /100 | #107 | Exceptional 5.1% |
| Puget Sound Salish | 93.0 /100 | #108 | Exceptional 5.1% |
| Immigrants | Eastern Africa | 92.8 /100 | #109 | Exceptional 5.1% |
| Macedonians | 92.4 /100 | #110 | Exceptional 5.1% |
| Immigrants | Burma/Myanmar | 92.3 /100 | #111 | Exceptional 5.1% |
| Estonians | 92.1 /100 | #112 | Exceptional 5.1% |