Iroquois vs Honduran Unemployment Among Ages 20 to 24 years
COMPARE
Iroquois
Honduran
Unemployment Among Ages 20 to 24 years
Unemployment Among Ages 20 to 24 years Comparison
Iroquois
Hondurans
10.1%
UNEMPLOYMENT AMONG AGES 20 TO 24 YEARS
93.4/ 100
METRIC RATING
107th/ 347
METRIC RANK
10.5%
UNEMPLOYMENT AMONG AGES 20 TO 24 YEARS
10.5/ 100
METRIC RATING
215th/ 347
METRIC RANK
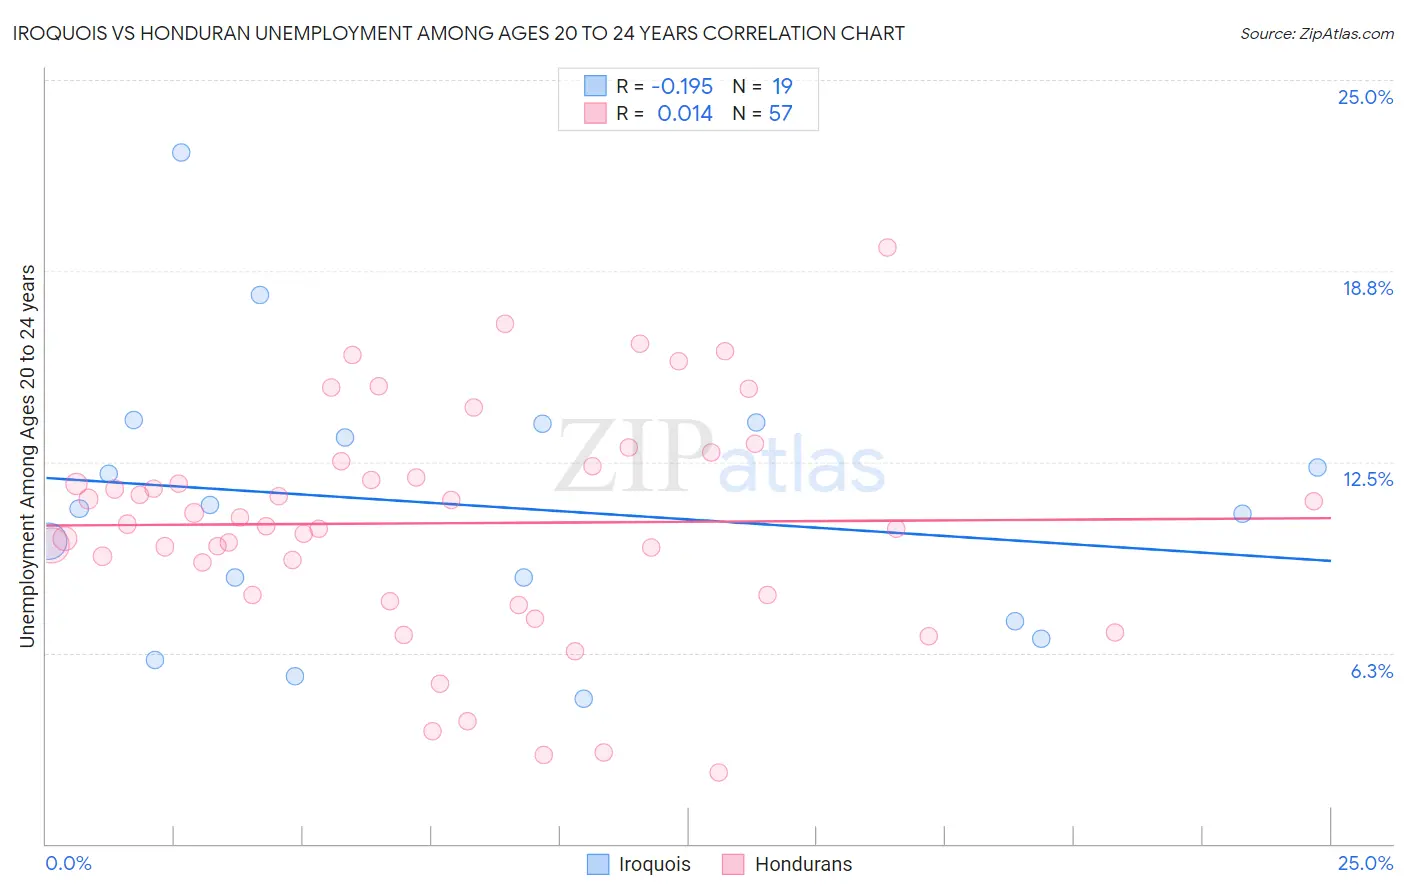
Iroquois vs Honduran Unemployment Among Ages 20 to 24 years Correlation Chart
The statistical analysis conducted on geographies consisting of 202,668,873 people shows a poor negative correlation between the proportion of Iroquois and unemployment rate among population between the ages 20 and 24 in the United States with a correlation coefficient (R) of -0.195 and weighted average of 10.1%. Similarly, the statistical analysis conducted on geographies consisting of 349,877,881 people shows no correlation between the proportion of Hondurans and unemployment rate among population between the ages 20 and 24 in the United States with a correlation coefficient (R) of 0.014 and weighted average of 10.5%, a difference of 4.5%.
Unemployment Among Ages 20 to 24 years Correlation Summary
| Measurement | Iroquois | Honduran |
| Minimum | 4.7% | 2.3% |
| Maximum | 22.6% | 19.5% |
| Range | 17.9% | 17.2% |
| Mean | 11.1% | 10.5% |
| Median | 11.0% | 10.5% |
| Interquartile 25% (IQ1) | 7.3% | 8.2% |
| Interquartile 75% (IQ3) | 13.7% | 12.4% |
| Interquartile Range (IQR) | 6.5% | 4.3% |
| Standard Deviation (Sample) | 4.4% | 3.7% |
| Standard Deviation (Population) | 4.3% | 3.6% |
Similar Demographics by Unemployment Among Ages 20 to 24 years
Demographics Similar to Iroquois by Unemployment Among Ages 20 to 24 years
In terms of unemployment among ages 20 to 24 years, the demographic groups most similar to Iroquois are Immigrants from Latvia (10.1%, a difference of 0.030%), Filipino (10.1%, a difference of 0.030%), Immigrants from Spain (10.1%, a difference of 0.040%), Pennsylvania German (10.0%, a difference of 0.070%), and Immigrants from Hungary (10.0%, a difference of 0.090%).
| Demographics | Rating | Rank | Unemployment Among Ages 20 to 24 years |
| Immigrants | France | 95.2 /100 | #100 | Exceptional 10.0% |
| Laotians | 95.1 /100 | #101 | Exceptional 10.0% |
| Immigrants | Argentina | 94.9 /100 | #102 | Exceptional 10.0% |
| Irish | 94.3 /100 | #103 | Exceptional 10.0% |
| Immigrants | Chile | 94.0 /100 | #104 | Exceptional 10.0% |
| Immigrants | Hungary | 94.0 /100 | #105 | Exceptional 10.0% |
| Pennsylvania Germans | 93.9 /100 | #106 | Exceptional 10.0% |
| Iroquois | 93.4 /100 | #107 | Exceptional 10.1% |
| Immigrants | Latvia | 93.2 /100 | #108 | Exceptional 10.1% |
| Filipinos | 93.2 /100 | #109 | Exceptional 10.1% |
| Immigrants | Spain | 93.1 /100 | #110 | Exceptional 10.1% |
| Immigrants | Indonesia | 92.7 /100 | #111 | Exceptional 10.1% |
| Northern Europeans | 92.7 /100 | #112 | Exceptional 10.1% |
| German Russians | 92.4 /100 | #113 | Exceptional 10.1% |
| Ottawa | 90.8 /100 | #114 | Exceptional 10.1% |
Demographics Similar to Hondurans by Unemployment Among Ages 20 to 24 years
In terms of unemployment among ages 20 to 24 years, the demographic groups most similar to Hondurans are Costa Rican (10.5%, a difference of 0.090%), Kiowa (10.5%, a difference of 0.11%), Cherokee (10.5%, a difference of 0.12%), Guatemalan (10.5%, a difference of 0.15%), and Nonimmigrants (10.5%, a difference of 0.18%).
| Demographics | Rating | Rank | Unemployment Among Ages 20 to 24 years |
| Immigrants | Hong Kong | 17.6 /100 | #208 | Poor 10.5% |
| Peruvians | 17.2 /100 | #209 | Poor 10.5% |
| Immigrants | Belgium | 16.9 /100 | #210 | Poor 10.5% |
| Immigrants | Guatemala | 14.6 /100 | #211 | Poor 10.5% |
| Immigrants | Sri Lanka | 14.0 /100 | #212 | Poor 10.5% |
| Guatemalans | 12.2 /100 | #213 | Poor 10.5% |
| Kiowa | 11.7 /100 | #214 | Poor 10.5% |
| Hondurans | 10.5 /100 | #215 | Poor 10.5% |
| Costa Ricans | 9.6 /100 | #216 | Tragic 10.5% |
| Cherokee | 9.3 /100 | #217 | Tragic 10.5% |
| Immigrants | Nonimmigrants | 8.8 /100 | #218 | Tragic 10.5% |
| Immigrants | Southern Europe | 8.0 /100 | #219 | Tragic 10.5% |
| Eastern Europeans | 6.9 /100 | #220 | Tragic 10.6% |
| Central Americans | 6.8 /100 | #221 | Tragic 10.6% |
| Immigrants | Poland | 6.4 /100 | #222 | Tragic 10.6% |