Iroquois vs Filipino Unemployment Among Seniors over 65 years
COMPARE
Iroquois
Filipino
Unemployment Among Seniors over 65 years
Unemployment Among Seniors over 65 years Comparison
Iroquois
Filipinos
4.9%
UNEMPLOYMENT AMONG SENIORS OVER 65 YEARS
99.5/ 100
METRIC RATING
67th/ 347
METRIC RANK
5.0%
UNEMPLOYMENT AMONG SENIORS OVER 65 YEARS
98.3/ 100
METRIC RATING
84th/ 347
METRIC RANK
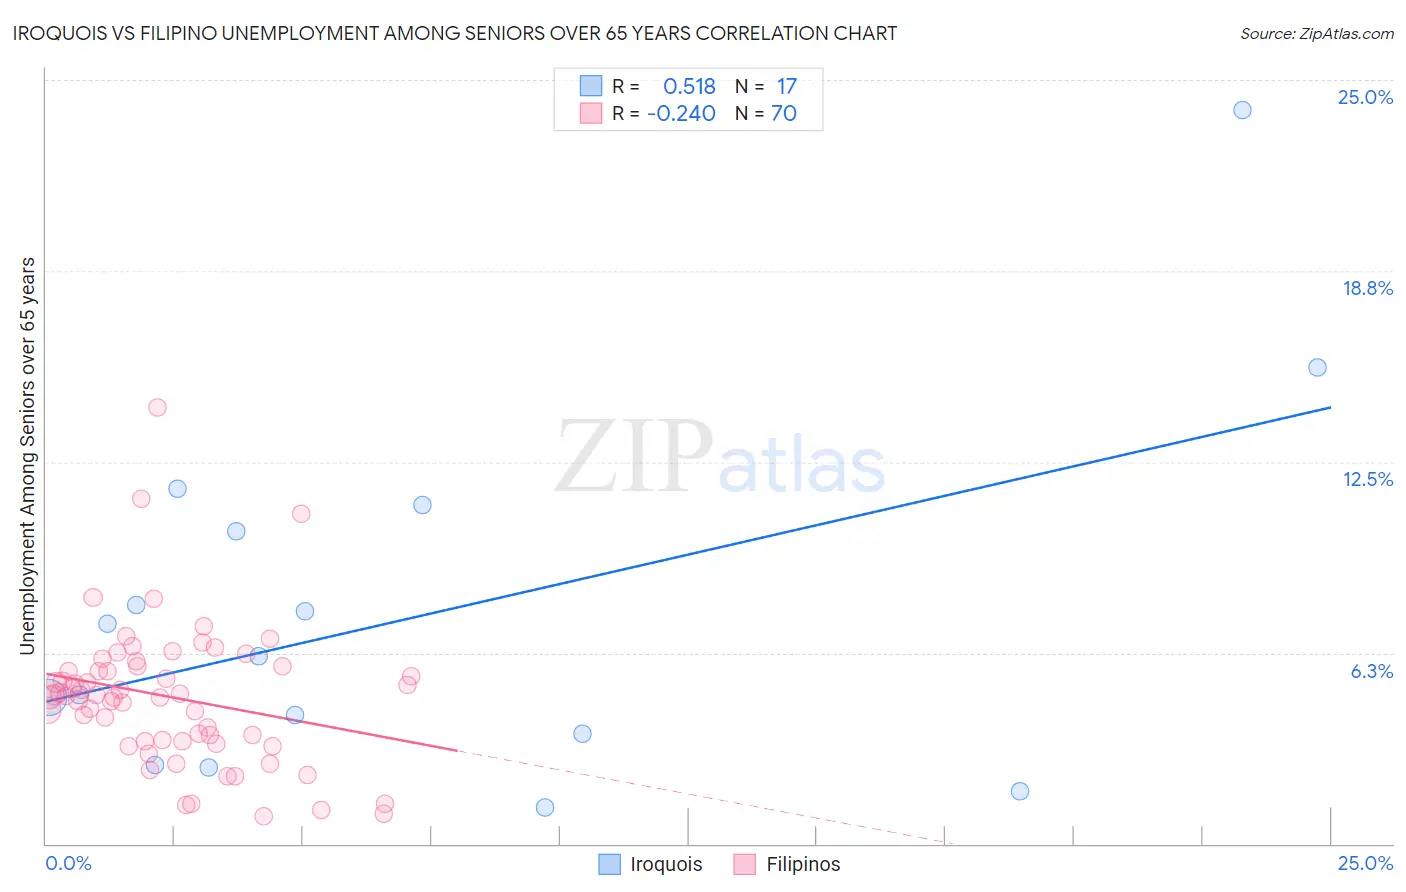
Iroquois vs Filipino Unemployment Among Seniors over 65 years Correlation Chart
The statistical analysis conducted on geographies consisting of 190,755,899 people shows a substantial positive correlation between the proportion of Iroquois and unemployment rate amomg seniors over the age of 65 in the United States with a correlation coefficient (R) of 0.518 and weighted average of 4.9%. Similarly, the statistical analysis conducted on geographies consisting of 238,785,909 people shows a weak negative correlation between the proportion of Filipinos and unemployment rate amomg seniors over the age of 65 in the United States with a correlation coefficient (R) of -0.240 and weighted average of 5.0%, a difference of 1.1%.
Unemployment Among Seniors over 65 years Correlation Summary
| Measurement | Iroquois | Filipino |
| Minimum | 1.2% | 0.90% |
| Maximum | 24.0% | 14.3% |
| Range | 22.8% | 13.4% |
| Mean | 7.5% | 4.8% |
| Median | 6.1% | 4.9% |
| Interquartile 25% (IQ1) | 3.1% | 3.4% |
| Interquartile 75% (IQ3) | 10.7% | 5.8% |
| Interquartile Range (IQR) | 7.6% | 2.4% |
| Standard Deviation (Sample) | 5.8% | 2.3% |
| Standard Deviation (Population) | 5.6% | 2.3% |
Demographics Similar to Iroquois and Filipinos by Unemployment Among Seniors over 65 years
In terms of unemployment among seniors over 65 years, the demographic groups most similar to Iroquois are English (4.9%, a difference of 0.020%), Bolivian (4.9%, a difference of 0.030%), Immigrants from Nicaragua (4.9%, a difference of 0.070%), Scottish (4.9%, a difference of 0.080%), and Immigrants from Kazakhstan (4.9%, a difference of 0.15%). Similarly, the demographic groups most similar to Filipinos are Immigrants from Zimbabwe (5.0%, a difference of 0.010%), Serbian (5.0%, a difference of 0.040%), Immigrants from Hungary (5.0%, a difference of 0.060%), Estonian (5.0%, a difference of 0.070%), and Immigrants from Ethiopia (5.0%, a difference of 0.17%).
| Demographics | Rating | Rank | Unemployment Among Seniors over 65 years |
| Immigrants | Nicaragua | 99.6 /100 | #65 | Exceptional 4.9% |
| English | 99.5 /100 | #66 | Exceptional 4.9% |
| Iroquois | 99.5 /100 | #67 | Exceptional 4.9% |
| Bolivians | 99.5 /100 | #68 | Exceptional 4.9% |
| Scottish | 99.5 /100 | #69 | Exceptional 4.9% |
| Immigrants | Kazakhstan | 99.4 /100 | #70 | Exceptional 4.9% |
| Immigrants | Moldova | 99.4 /100 | #71 | Exceptional 4.9% |
| Nicaraguans | 99.3 /100 | #72 | Exceptional 4.9% |
| Immigrants | Japan | 99.2 /100 | #73 | Exceptional 4.9% |
| Japanese | 99.2 /100 | #74 | Exceptional 4.9% |
| British | 99.1 /100 | #75 | Exceptional 4.9% |
| Welsh | 99.1 /100 | #76 | Exceptional 5.0% |
| Thais | 99.1 /100 | #77 | Exceptional 5.0% |
| Slavs | 98.9 /100 | #78 | Exceptional 5.0% |
| Immigrants | Netherlands | 98.8 /100 | #79 | Exceptional 5.0% |
| Immigrants | Ethiopia | 98.6 /100 | #80 | Exceptional 5.0% |
| Estonians | 98.5 /100 | #81 | Exceptional 5.0% |
| Serbians | 98.4 /100 | #82 | Exceptional 5.0% |
| Immigrants | Zimbabwe | 98.3 /100 | #83 | Exceptional 5.0% |
| Filipinos | 98.3 /100 | #84 | Exceptional 5.0% |
| Immigrants | Hungary | 98.2 /100 | #85 | Exceptional 5.0% |