Irish vs Maltese Unemployment Among Women with Children Under 18 years
COMPARE
Irish
Maltese
Unemployment Among Women with Children Under 18 years
Unemployment Among Women with Children Under 18 years Comparison
Irish
Maltese
5.1%
UNEMPLOYMENT AMONG WOMEN WITH CHILDREN UNDER 18 YEARS
96.8/ 100
METRIC RATING
68th/ 347
METRIC RANK
5.2%
UNEMPLOYMENT AMONG WOMEN WITH CHILDREN UNDER 18 YEARS
95.1/ 100
METRIC RATING
83rd/ 347
METRIC RANK
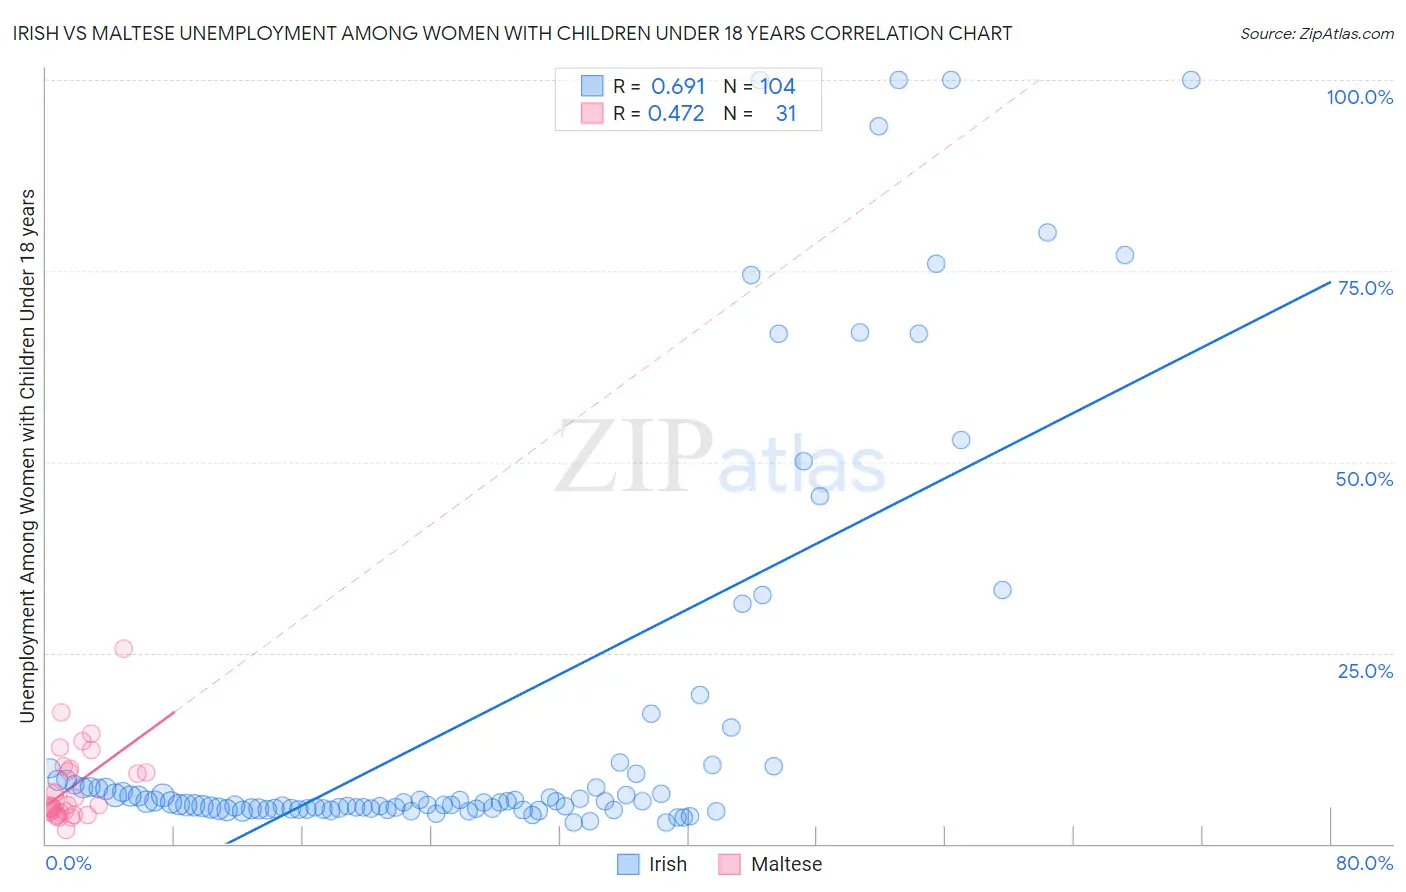
Irish vs Maltese Unemployment Among Women with Children Under 18 years Correlation Chart
The statistical analysis conducted on geographies consisting of 520,233,444 people shows a significant positive correlation between the proportion of Irish and unemployment rate among women with children under the age of 18 in the United States with a correlation coefficient (R) of 0.691 and weighted average of 5.1%. Similarly, the statistical analysis conducted on geographies consisting of 124,124,771 people shows a moderate positive correlation between the proportion of Maltese and unemployment rate among women with children under the age of 18 in the United States with a correlation coefficient (R) of 0.472 and weighted average of 5.2%, a difference of 0.84%.
Unemployment Among Women with Children Under 18 years Correlation Summary
| Measurement | Irish | Maltese |
| Minimum | 2.8% | 1.8% |
| Maximum | 100.0% | 25.6% |
| Range | 97.2% | 23.8% |
| Mean | 16.9% | 7.5% |
| Median | 5.5% | 5.1% |
| Interquartile 25% (IQ1) | 4.6% | 4.2% |
| Interquartile 75% (IQ3) | 8.8% | 9.8% |
| Interquartile Range (IQR) | 4.1% | 5.6% |
| Standard Deviation (Sample) | 26.2% | 5.1% |
| Standard Deviation (Population) | 26.0% | 5.0% |
Demographics Similar to Irish and Maltese by Unemployment Among Women with Children Under 18 years
In terms of unemployment among women with children under 18 years, the demographic groups most similar to Irish are Fijian (5.1%, a difference of 0.090%), Immigrants from Australia (5.1%, a difference of 0.11%), Austrian (5.1%, a difference of 0.14%), Icelander (5.1%, a difference of 0.14%), and Serbian (5.1%, a difference of 0.18%). Similarly, the demographic groups most similar to Maltese are Australian (5.2%, a difference of 0.0%), Romanian (5.2%, a difference of 0.10%), Paraguayan (5.2%, a difference of 0.11%), Immigrants from Lithuania (5.2%, a difference of 0.15%), and Bolivian (5.1%, a difference of 0.18%).
| Demographics | Rating | Rank | Unemployment Among Women with Children Under 18 years |
| Immigrants | Sweden | 97.1 /100 | #65 | Exceptional 5.1% |
| Immigrants | Australia | 97.0 /100 | #66 | Exceptional 5.1% |
| Fijians | 96.9 /100 | #67 | Exceptional 5.1% |
| Irish | 96.8 /100 | #68 | Exceptional 5.1% |
| Austrians | 96.6 /100 | #69 | Exceptional 5.1% |
| Icelanders | 96.6 /100 | #70 | Exceptional 5.1% |
| Serbians | 96.5 /100 | #71 | Exceptional 5.1% |
| Immigrants | Bolivia | 96.1 /100 | #72 | Exceptional 5.1% |
| Albanians | 95.9 /100 | #73 | Exceptional 5.1% |
| Immigrants | Northern Europe | 95.9 /100 | #74 | Exceptional 5.1% |
| Immigrants | Asia | 95.8 /100 | #75 | Exceptional 5.1% |
| Puget Sound Salish | 95.8 /100 | #76 | Exceptional 5.1% |
| Zimbabweans | 95.7 /100 | #77 | Exceptional 5.1% |
| Assyrians/Chaldeans/Syriacs | 95.7 /100 | #78 | Exceptional 5.1% |
| Immigrants | Croatia | 95.6 /100 | #79 | Exceptional 5.1% |
| Bolivians | 95.5 /100 | #80 | Exceptional 5.1% |
| Immigrants | Lithuania | 95.4 /100 | #81 | Exceptional 5.2% |
| Romanians | 95.3 /100 | #82 | Exceptional 5.2% |
| Maltese | 95.1 /100 | #83 | Exceptional 5.2% |
| Australians | 95.1 /100 | #84 | Exceptional 5.2% |
| Paraguayans | 94.8 /100 | #85 | Exceptional 5.2% |