Iraqi vs Immigrants from Haiti Unemployment Among Ages 55 to 59 years
COMPARE
Iraqi
Immigrants from Haiti
Unemployment Among Ages 55 to 59 years
Unemployment Among Ages 55 to 59 years Comparison
Iraqis
Immigrants from Haiti
4.7%
UNEMPLOYMENT AMONG AGES 55 TO 59 YEARS
96.1/ 100
METRIC RATING
92nd/ 347
METRIC RANK
4.9%
UNEMPLOYMENT AMONG AGES 55 TO 59 YEARS
13.3/ 100
METRIC RATING
209th/ 347
METRIC RANK
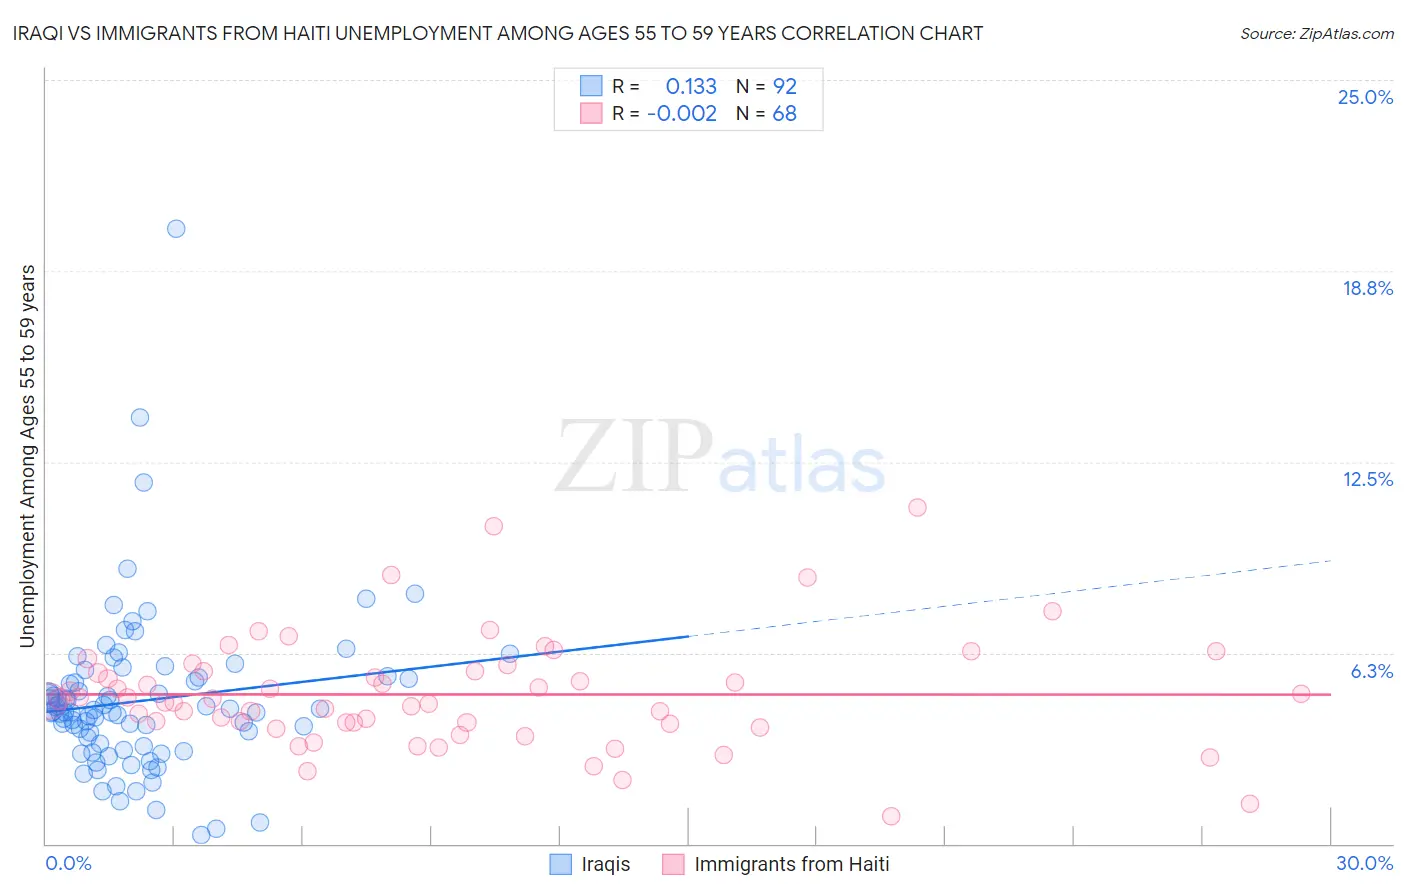
Iraqi vs Immigrants from Haiti Unemployment Among Ages 55 to 59 years Correlation Chart
The statistical analysis conducted on geographies consisting of 166,432,859 people shows a poor positive correlation between the proportion of Iraqis and unemployment rate among population between the ages 55 and 59 in the United States with a correlation coefficient (R) of 0.133 and weighted average of 4.7%. Similarly, the statistical analysis conducted on geographies consisting of 215,720,652 people shows no correlation between the proportion of Immigrants from Haiti and unemployment rate among population between the ages 55 and 59 in the United States with a correlation coefficient (R) of -0.002 and weighted average of 4.9%, a difference of 5.3%.
Unemployment Among Ages 55 to 59 years Correlation Summary
| Measurement | Iraqi | Immigrants from Haiti |
| Minimum | 0.30% | 0.90% |
| Maximum | 20.1% | 11.0% |
| Range | 19.8% | 10.1% |
| Mean | 4.7% | 4.9% |
| Median | 4.3% | 4.7% |
| Interquartile 25% (IQ1) | 3.2% | 3.9% |
| Interquartile 75% (IQ3) | 5.4% | 5.6% |
| Interquartile Range (IQR) | 2.2% | 1.7% |
| Standard Deviation (Sample) | 2.7% | 1.8% |
| Standard Deviation (Population) | 2.7% | 1.8% |
Similar Demographics by Unemployment Among Ages 55 to 59 years
Demographics Similar to Iraqis by Unemployment Among Ages 55 to 59 years
In terms of unemployment among ages 55 to 59 years, the demographic groups most similar to Iraqis are New Zealander (4.7%, a difference of 0.080%), Immigrants from England (4.7%, a difference of 0.080%), Immigrants from Scotland (4.7%, a difference of 0.080%), Immigrants from Poland (4.7%, a difference of 0.10%), and South African (4.7%, a difference of 0.12%).
| Demographics | Rating | Rank | Unemployment Among Ages 55 to 59 years |
| Immigrants | Vietnam | 96.9 /100 | #85 | Exceptional 4.7% |
| Immigrants | Colombia | 96.9 /100 | #86 | Exceptional 4.7% |
| Poles | 96.9 /100 | #87 | Exceptional 4.7% |
| Immigrants | Cameroon | 96.9 /100 | #88 | Exceptional 4.7% |
| Irish | 96.8 /100 | #89 | Exceptional 4.7% |
| Immigrants | Poland | 96.4 /100 | #90 | Exceptional 4.7% |
| New Zealanders | 96.3 /100 | #91 | Exceptional 4.7% |
| Iraqis | 96.1 /100 | #92 | Exceptional 4.7% |
| Immigrants | England | 95.8 /100 | #93 | Exceptional 4.7% |
| Immigrants | Scotland | 95.7 /100 | #94 | Exceptional 4.7% |
| South Africans | 95.6 /100 | #95 | Exceptional 4.7% |
| Immigrants | Belgium | 95.0 /100 | #96 | Exceptional 4.7% |
| Immigrants | Canada | 94.9 /100 | #97 | Exceptional 4.7% |
| Immigrants | Germany | 94.8 /100 | #98 | Exceptional 4.7% |
| Yugoslavians | 94.7 /100 | #99 | Exceptional 4.7% |
Demographics Similar to Immigrants from Haiti by Unemployment Among Ages 55 to 59 years
In terms of unemployment among ages 55 to 59 years, the demographic groups most similar to Immigrants from Haiti are Creek (4.9%, a difference of 0.030%), Hawaiian (4.9%, a difference of 0.040%), Immigrants from Kazakhstan (4.9%, a difference of 0.060%), Immigrants from Belarus (4.9%, a difference of 0.070%), and Immigrants from Australia (4.9%, a difference of 0.070%).
| Demographics | Rating | Rank | Unemployment Among Ages 55 to 59 years |
| Lumbee | 22.5 /100 | #202 | Fair 4.9% |
| Guamanians/Chamorros | 20.8 /100 | #203 | Fair 4.9% |
| Immigrants | Latvia | 18.5 /100 | #204 | Poor 4.9% |
| Haitians | 18.1 /100 | #205 | Poor 4.9% |
| Immigrants | Belarus | 14.1 /100 | #206 | Poor 4.9% |
| Immigrants | Australia | 14.1 /100 | #207 | Poor 4.9% |
| Immigrants | Kazakhstan | 14.0 /100 | #208 | Poor 4.9% |
| Immigrants | Haiti | 13.3 /100 | #209 | Poor 4.9% |
| Creek | 12.9 /100 | #210 | Poor 4.9% |
| Hawaiians | 12.8 /100 | #211 | Poor 4.9% |
| Immigrants | Nonimmigrants | 11.2 /100 | #212 | Poor 4.9% |
| Bermudans | 11.0 /100 | #213 | Poor 4.9% |
| Immigrants | Denmark | 10.3 /100 | #214 | Poor 4.9% |
| Syrians | 8.6 /100 | #215 | Tragic 4.9% |
| Spanish Americans | 8.1 /100 | #216 | Tragic 4.9% |