Iranian vs Immigrants from Asia Unemployment Among Seniors over 65 years
COMPARE
Iranian
Immigrants from Asia
Unemployment Among Seniors over 65 years
Unemployment Among Seniors over 65 years Comparison
Iranians
Immigrants from Asia
5.1%
UNEMPLOYMENT AMONG SENIORS OVER 65 YEARS
86.6/ 100
METRIC RATING
130th/ 347
METRIC RANK
5.1%
UNEMPLOYMENT AMONG SENIORS OVER 65 YEARS
75.6/ 100
METRIC RATING
150th/ 347
METRIC RANK
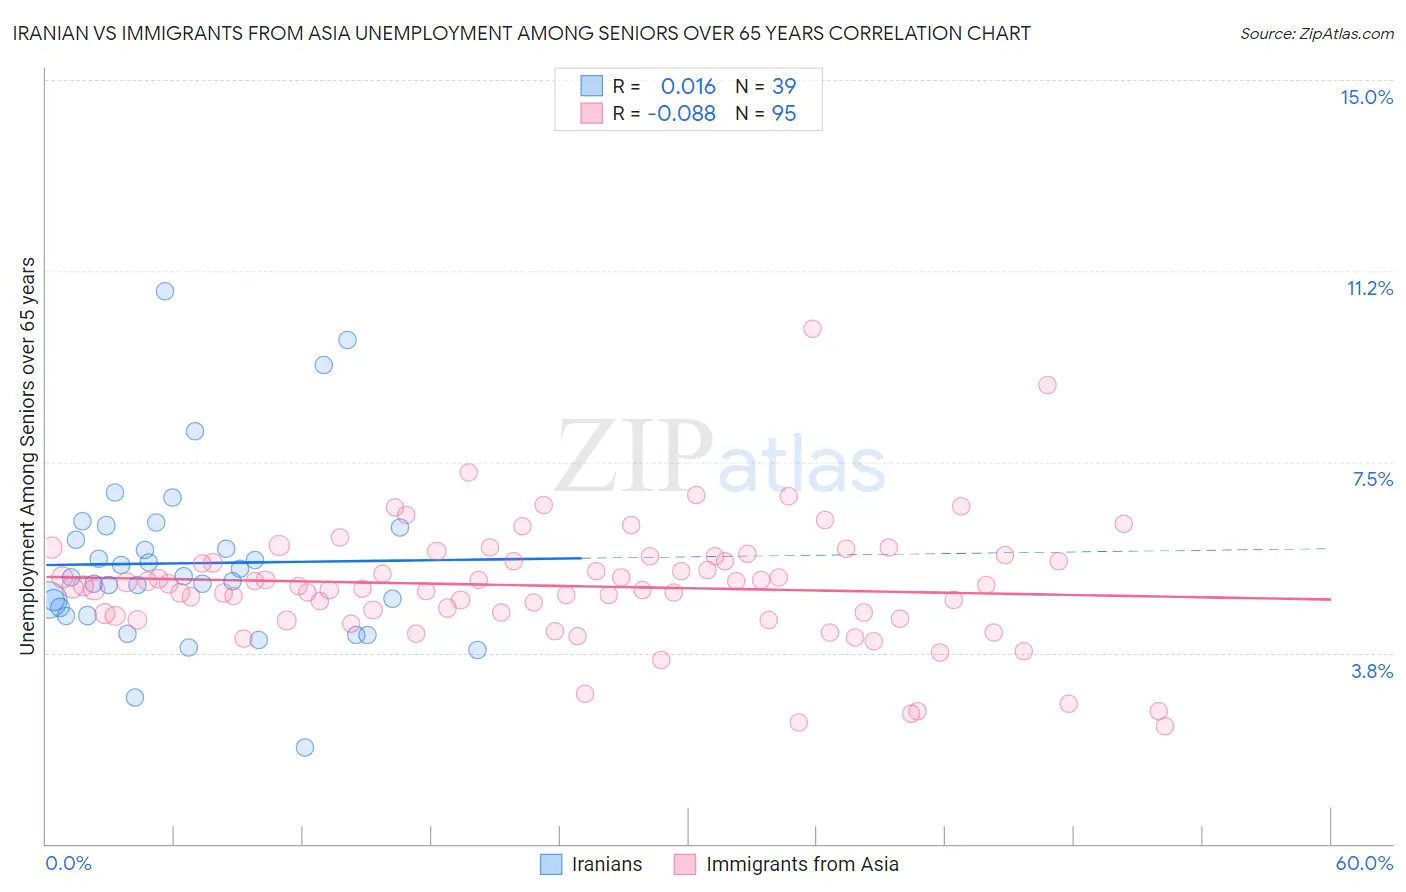
Iranian vs Immigrants from Asia Unemployment Among Seniors over 65 years Correlation Chart
The statistical analysis conducted on geographies consisting of 294,545,936 people shows no correlation between the proportion of Iranians and unemployment rate amomg seniors over the age of 65 in the United States with a correlation coefficient (R) of 0.016 and weighted average of 5.1%. Similarly, the statistical analysis conducted on geographies consisting of 456,255,455 people shows a slight negative correlation between the proportion of Immigrants from Asia and unemployment rate amomg seniors over the age of 65 in the United States with a correlation coefficient (R) of -0.088 and weighted average of 5.1%, a difference of 0.60%.
Unemployment Among Seniors over 65 years Correlation Summary
| Measurement | Iranian | Immigrants from Asia |
| Minimum | 1.9% | 2.3% |
| Maximum | 10.9% | 10.1% |
| Range | 9.0% | 7.8% |
| Mean | 5.5% | 5.1% |
| Median | 5.2% | 5.1% |
| Interquartile 25% (IQ1) | 4.5% | 4.5% |
| Interquartile 75% (IQ3) | 6.2% | 5.6% |
| Interquartile Range (IQR) | 1.7% | 1.2% |
| Standard Deviation (Sample) | 1.7% | 1.2% |
| Standard Deviation (Population) | 1.7% | 1.2% |
Demographics Similar to Iranians and Immigrants from Asia by Unemployment Among Seniors over 65 years
In terms of unemployment among seniors over 65 years, the demographic groups most similar to Iranians are Immigrants from Australia (5.1%, a difference of 0.060%), Chilean (5.1%, a difference of 0.070%), Syrian (5.1%, a difference of 0.090%), Turkish (5.1%, a difference of 0.12%), and Ukrainian (5.1%, a difference of 0.14%). Similarly, the demographic groups most similar to Immigrants from Asia are Immigrants from Afghanistan (5.1%, a difference of 0.050%), Greek (5.1%, a difference of 0.060%), Slovak (5.1%, a difference of 0.10%), Immigrants from Russia (5.1%, a difference of 0.14%), and Spanish (5.1%, a difference of 0.15%).
| Demographics | Rating | Rank | Unemployment Among Seniors over 65 years |
| Iranians | 86.6 /100 | #130 | Excellent 5.1% |
| Immigrants | Australia | 85.8 /100 | #131 | Excellent 5.1% |
| Chileans | 85.6 /100 | #132 | Excellent 5.1% |
| Syrians | 85.3 /100 | #133 | Excellent 5.1% |
| Turks | 84.9 /100 | #134 | Excellent 5.1% |
| Ukrainians | 84.4 /100 | #135 | Excellent 5.1% |
| Whites/Caucasians | 84.4 /100 | #136 | Excellent 5.1% |
| Arabs | 84.3 /100 | #137 | Excellent 5.1% |
| New Zealanders | 83.2 /100 | #138 | Excellent 5.1% |
| Immigrants | Panama | 83.0 /100 | #139 | Excellent 5.1% |
| Immigrants | Chile | 83.0 /100 | #140 | Excellent 5.1% |
| Cherokee | 81.6 /100 | #141 | Excellent 5.1% |
| Immigrants | Indonesia | 81.0 /100 | #142 | Excellent 5.1% |
| Senegalese | 80.4 /100 | #143 | Excellent 5.1% |
| Poles | 80.3 /100 | #144 | Excellent 5.1% |
| Spanish | 78.8 /100 | #145 | Good 5.1% |
| Immigrants | Russia | 78.5 /100 | #146 | Good 5.1% |
| Slovaks | 77.9 /100 | #147 | Good 5.1% |
| Greeks | 77.0 /100 | #148 | Good 5.1% |
| Immigrants | Afghanistan | 76.8 /100 | #149 | Good 5.1% |
| Immigrants | Asia | 75.6 /100 | #150 | Good 5.1% |