Inupiat vs Somali Unemployment Among Ages 45 to 54 years
COMPARE
Inupiat
Somali
Unemployment Among Ages 45 to 54 years
Unemployment Among Ages 45 to 54 years Comparison
Inupiat
Somalis
9.2%
UNEMPLOYMENT AMONG AGES 45 TO 54 YEARS
0.0/ 100
METRIC RATING
343rd/ 347
METRIC RANK
5.0%
UNEMPLOYMENT AMONG AGES 45 TO 54 YEARS
0.0/ 100
METRIC RATING
269th/ 347
METRIC RANK
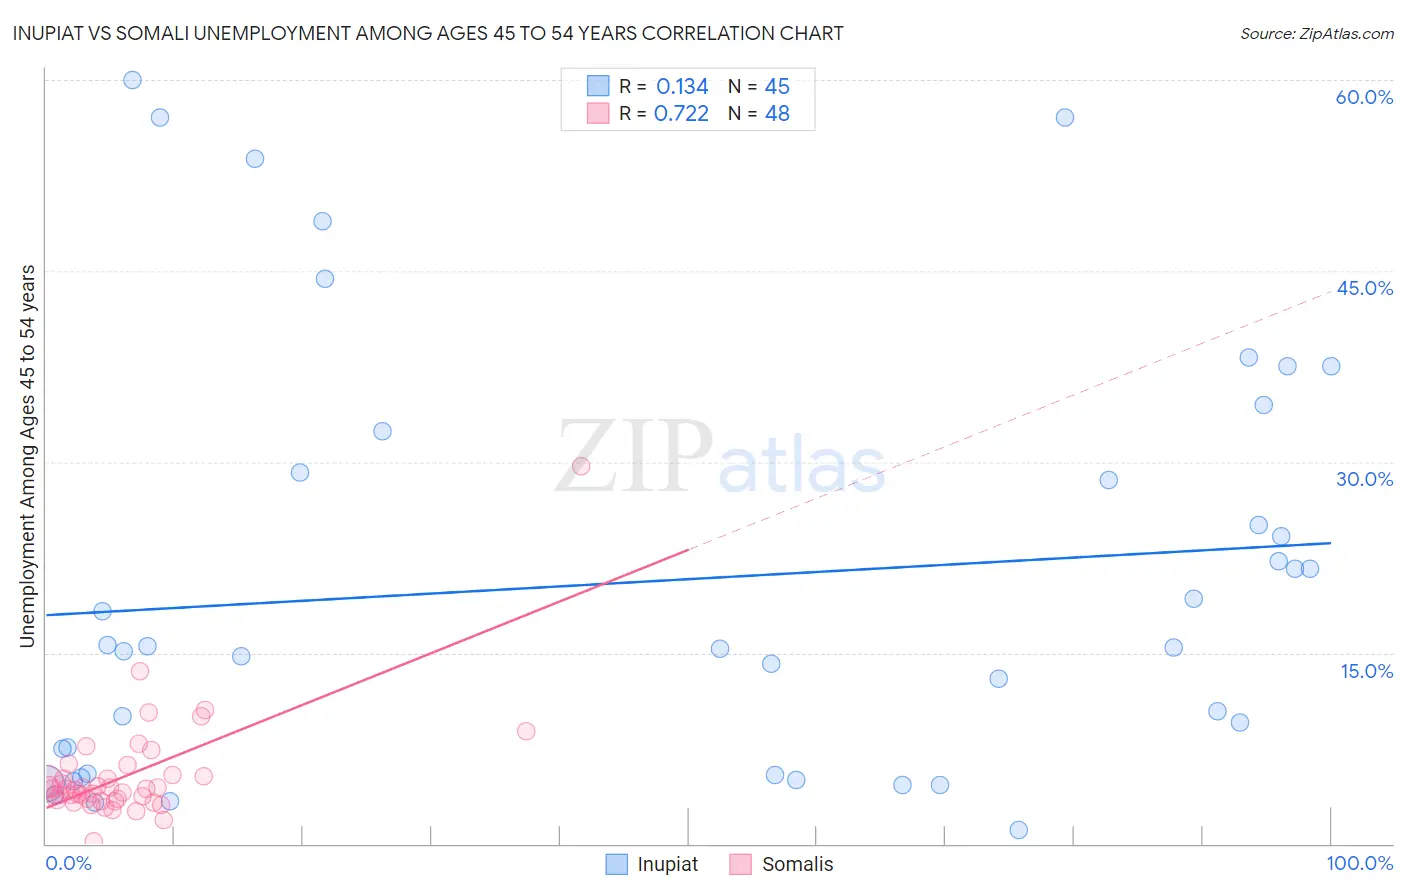
Inupiat vs Somali Unemployment Among Ages 45 to 54 years Correlation Chart
The statistical analysis conducted on geographies consisting of 95,350,255 people shows a poor positive correlation between the proportion of Inupiat and unemployment rate among population between the ages 45 and 54 in the United States with a correlation coefficient (R) of 0.134 and weighted average of 9.2%. Similarly, the statistical analysis conducted on geographies consisting of 98,335,051 people shows a strong positive correlation between the proportion of Somalis and unemployment rate among population between the ages 45 and 54 in the United States with a correlation coefficient (R) of 0.722 and weighted average of 5.0%, a difference of 85.4%.
Unemployment Among Ages 45 to 54 years Correlation Summary
| Measurement | Inupiat | Somali |
| Minimum | 1.1% | 0.20% |
| Maximum | 60.0% | 29.7% |
| Range | 58.9% | 29.5% |
| Mean | 20.6% | 5.4% |
| Median | 15.4% | 4.3% |
| Interquartile 25% (IQ1) | 5.4% | 3.5% |
| Interquartile 75% (IQ3) | 30.8% | 5.3% |
| Interquartile Range (IQR) | 25.4% | 1.9% |
| Standard Deviation (Sample) | 16.7% | 4.3% |
| Standard Deviation (Population) | 16.5% | 4.3% |
Similar Demographics by Unemployment Among Ages 45 to 54 years
Demographics Similar to Inupiat by Unemployment Among Ages 45 to 54 years
In terms of unemployment among ages 45 to 54 years, the demographic groups most similar to Inupiat are Yuman (9.5%, a difference of 3.3%), Alaskan Athabascan (8.5%, a difference of 8.6%), Cheyenne (10.6%, a difference of 15.0%), Paiute (7.8%, a difference of 18.1%), and Hopi (7.5%, a difference of 22.2%).
| Demographics | Rating | Rank | Unemployment Among Ages 45 to 54 years |
| Immigrants | Yemen | 0.0 /100 | #333 | Tragic 6.5% |
| Sioux | 0.0 /100 | #334 | Tragic 6.6% |
| Navajo | 0.0 /100 | #335 | Tragic 6.7% |
| Puerto Ricans | 0.0 /100 | #336 | Tragic 6.8% |
| Apache | 0.0 /100 | #337 | Tragic 7.0% |
| Colville | 0.0 /100 | #338 | Tragic 7.4% |
| Arapaho | 0.0 /100 | #339 | Tragic 7.5% |
| Hopi | 0.0 /100 | #340 | Tragic 7.5% |
| Paiute | 0.0 /100 | #341 | Tragic 7.8% |
| Alaskan Athabascans | 0.0 /100 | #342 | Tragic 8.5% |
| Inupiat | 0.0 /100 | #343 | Tragic 9.2% |
| Yuman | 0.0 /100 | #344 | Tragic 9.5% |
| Cheyenne | 0.0 /100 | #345 | Tragic 10.6% |
| Yup'ik | 0.0 /100 | #346 | Tragic 11.9% |
| Crow | 0.0 /100 | #347 | Tragic 13.7% |
Demographics Similar to Somalis by Unemployment Among Ages 45 to 54 years
In terms of unemployment among ages 45 to 54 years, the demographic groups most similar to Somalis are Immigrants from Ghana (5.0%, a difference of 0.14%), Cajun (5.0%, a difference of 0.22%), Immigrants from Uzbekistan (4.9%, a difference of 0.39%), Immigrants from Central America (5.0%, a difference of 0.39%), and Bahamian (4.9%, a difference of 0.47%).
| Demographics | Rating | Rank | Unemployment Among Ages 45 to 54 years |
| Mexicans | 0.1 /100 | #262 | Tragic 4.9% |
| Immigrants | Fiji | 0.1 /100 | #263 | Tragic 4.9% |
| Immigrants | Guatemala | 0.1 /100 | #264 | Tragic 4.9% |
| Immigrants | Somalia | 0.1 /100 | #265 | Tragic 4.9% |
| Ghanaians | 0.0 /100 | #266 | Tragic 4.9% |
| Bahamians | 0.0 /100 | #267 | Tragic 4.9% |
| Immigrants | Uzbekistan | 0.0 /100 | #268 | Tragic 4.9% |
| Somalis | 0.0 /100 | #269 | Tragic 5.0% |
| Immigrants | Ghana | 0.0 /100 | #270 | Tragic 5.0% |
| Cajuns | 0.0 /100 | #271 | Tragic 5.0% |
| Immigrants | Central America | 0.0 /100 | #272 | Tragic 5.0% |
| Immigrants | Latin America | 0.0 /100 | #273 | Tragic 5.0% |
| U.S. Virgin Islanders | 0.0 /100 | #274 | Tragic 5.0% |
| Bermudans | 0.0 /100 | #275 | Tragic 5.0% |
| French American Indians | 0.0 /100 | #276 | Tragic 5.0% |