Inupiat vs Immigrants from Nicaragua Unemployment Among Women with Children Under 6 years
COMPARE
Inupiat
Immigrants from Nicaragua
Unemployment Among Women with Children Under 6 years
Unemployment Among Women with Children Under 6 years Comparison
Inupiat
Immigrants from Nicaragua
17.7%
UNEMPLOYMENT AMONG WOMEN WITH CHILDREN UNDER 6 YEARS
0.0/ 100
METRIC RATING
345th/ 347
METRIC RANK
7.2%
UNEMPLOYMENT AMONG WOMEN WITH CHILDREN UNDER 6 YEARS
97.3/ 100
METRIC RATING
102nd/ 347
METRIC RANK
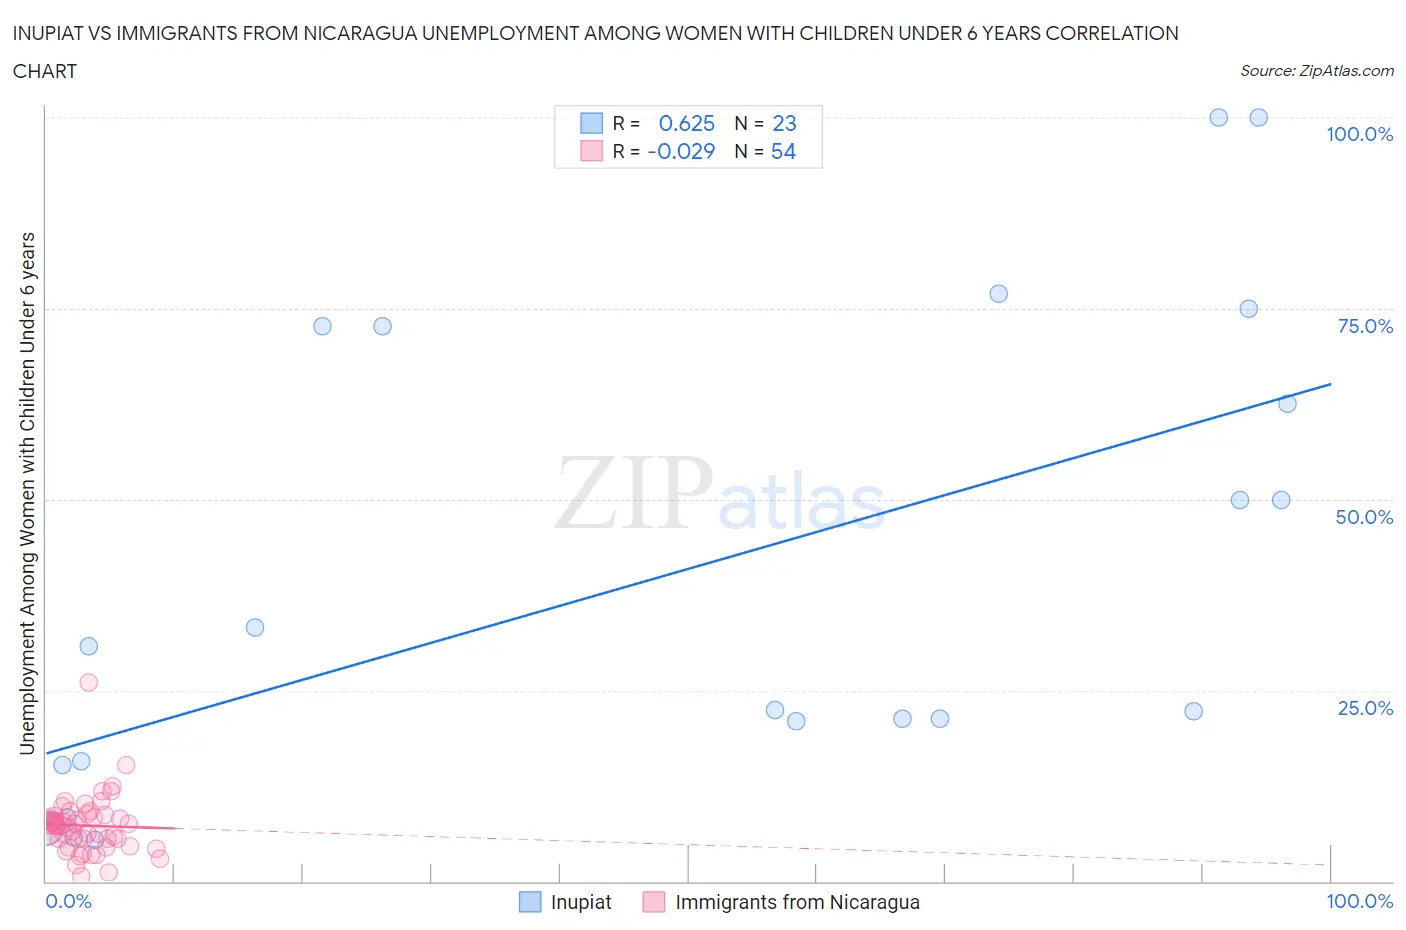
Inupiat vs Immigrants from Nicaragua Unemployment Among Women with Children Under 6 years Correlation Chart
The statistical analysis conducted on geographies consisting of 87,378,502 people shows a significant positive correlation between the proportion of Inupiat and unemployment rate among women with children under the age of 6 in the United States with a correlation coefficient (R) of 0.625 and weighted average of 17.7%. Similarly, the statistical analysis conducted on geographies consisting of 200,218,273 people shows no correlation between the proportion of Immigrants from Nicaragua and unemployment rate among women with children under the age of 6 in the United States with a correlation coefficient (R) of -0.029 and weighted average of 7.2%, a difference of 146.2%.
Unemployment Among Women with Children Under 6 years Correlation Summary
| Measurement | Inupiat | Immigrants from Nicaragua |
| Minimum | 5.5% | 0.70% |
| Maximum | 100.0% | 26.1% |
| Range | 94.5% | 25.4% |
| Mean | 39.0% | 7.3% |
| Median | 22.4% | 7.3% |
| Interquartile 25% (IQ1) | 15.2% | 5.5% |
| Interquartile 75% (IQ3) | 72.7% | 8.5% |
| Interquartile Range (IQR) | 57.5% | 3.0% |
| Standard Deviation (Sample) | 31.0% | 3.9% |
| Standard Deviation (Population) | 30.3% | 3.8% |
Similar Demographics by Unemployment Among Women with Children Under 6 years
Demographics Similar to Inupiat by Unemployment Among Women with Children Under 6 years
In terms of unemployment among women with children under 6 years, the demographic groups most similar to Inupiat are Hopi (16.8%, a difference of 5.6%), Arapaho (19.0%, a difference of 7.5%), Yup'ik (21.1%, a difference of 18.9%), Crow (14.6%, a difference of 20.9%), and Yuman (14.6%, a difference of 21.0%).
| Demographics | Rating | Rank | Unemployment Among Women with Children Under 6 years |
| Natives/Alaskans | 0.0 /100 | #333 | Tragic 11.5% |
| Apache | 0.0 /100 | #334 | Tragic 12.3% |
| Puerto Ricans | 0.0 /100 | #335 | Tragic 12.5% |
| Shoshone | 0.0 /100 | #336 | Tragic 13.2% |
| Chippewa | 0.0 /100 | #337 | Tragic 13.3% |
| Pima | 0.0 /100 | #338 | Tragic 13.4% |
| Navajo | 0.0 /100 | #339 | Tragic 13.5% |
| Immigrants | Yemen | 0.0 /100 | #340 | Tragic 13.5% |
| Lumbee | 0.0 /100 | #341 | Tragic 13.8% |
| Yuman | 0.0 /100 | #342 | Tragic 14.6% |
| Crow | 0.0 /100 | #343 | Tragic 14.6% |
| Hopi | 0.0 /100 | #344 | Tragic 16.8% |
| Inupiat | 0.0 /100 | #345 | Tragic 17.7% |
| Arapaho | 0.0 /100 | #346 | Tragic 19.0% |
| Yup'ik | 0.0 /100 | #347 | Tragic 21.1% |
Demographics Similar to Immigrants from Nicaragua by Unemployment Among Women with Children Under 6 years
In terms of unemployment among women with children under 6 years, the demographic groups most similar to Immigrants from Nicaragua are Immigrants from Saudi Arabia (7.2%, a difference of 0.0%), Chilean (7.2%, a difference of 0.030%), Immigrants from Northern Europe (7.2%, a difference of 0.050%), Immigrants from Egypt (7.2%, a difference of 0.080%), and Venezuelan (7.2%, a difference of 0.090%).
| Demographics | Rating | Rank | Unemployment Among Women with Children Under 6 years |
| Romanians | 97.7 /100 | #95 | Exceptional 7.2% |
| Immigrants | Eastern Africa | 97.7 /100 | #96 | Exceptional 7.2% |
| Immigrants | South Eastern Asia | 97.6 /100 | #97 | Exceptional 7.2% |
| Russians | 97.5 /100 | #98 | Exceptional 7.2% |
| Immigrants | Europe | 97.5 /100 | #99 | Exceptional 7.2% |
| Immigrants | Northern Europe | 97.4 /100 | #100 | Exceptional 7.2% |
| Chileans | 97.4 /100 | #101 | Exceptional 7.2% |
| Immigrants | Nicaragua | 97.3 /100 | #102 | Exceptional 7.2% |
| Immigrants | Saudi Arabia | 97.3 /100 | #103 | Exceptional 7.2% |
| Immigrants | Egypt | 97.2 /100 | #104 | Exceptional 7.2% |
| Venezuelans | 97.2 /100 | #105 | Exceptional 7.2% |
| Immigrants | Pakistan | 97.2 /100 | #106 | Exceptional 7.2% |
| Immigrants | Kazakhstan | 97.1 /100 | #107 | Exceptional 7.2% |
| Eastern Europeans | 96.9 /100 | #108 | Exceptional 7.2% |
| Australians | 96.9 /100 | #109 | Exceptional 7.2% |