Inupiat vs Immigrants from Haiti Unemployment Among Youth under 25 years
COMPARE
Inupiat
Immigrants from Haiti
Unemployment Among Youth under 25 years
Unemployment Among Youth under 25 years Comparison
Inupiat
Immigrants from Haiti
22.0%
UNEMPLOYMENT AMONG YOUTH UNDER 25 YEARS
0.0/ 100
METRIC RATING
346th/ 347
METRIC RANK
14.0%
UNEMPLOYMENT AMONG YOUTH UNDER 25 YEARS
0.0/ 100
METRIC RATING
307th/ 347
METRIC RANK
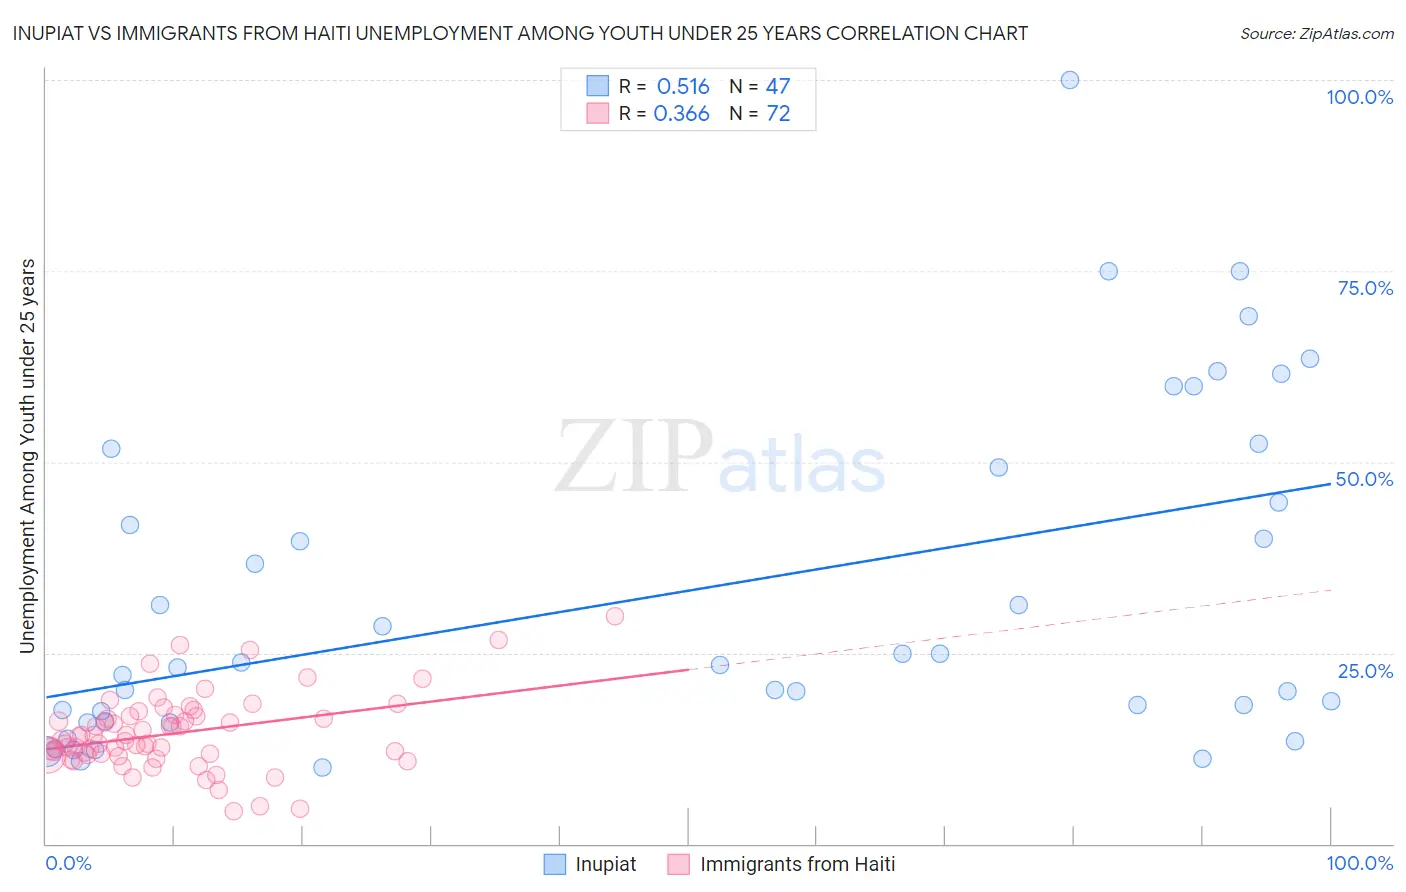
Inupiat vs Immigrants from Haiti Unemployment Among Youth under 25 years Correlation Chart
The statistical analysis conducted on geographies consisting of 95,982,795 people shows a substantial positive correlation between the proportion of Inupiat and unemployment rate among youth under the age of 25 in the United States with a correlation coefficient (R) of 0.516 and weighted average of 22.0%. Similarly, the statistical analysis conducted on geographies consisting of 223,689,556 people shows a mild positive correlation between the proportion of Immigrants from Haiti and unemployment rate among youth under the age of 25 in the United States with a correlation coefficient (R) of 0.366 and weighted average of 14.0%, a difference of 57.6%.
Unemployment Among Youth under 25 years Correlation Summary
| Measurement | Inupiat | Immigrants from Haiti |
| Minimum | 10.0% | 4.2% |
| Maximum | 100.0% | 29.8% |
| Range | 90.0% | 25.6% |
| Mean | 32.8% | 14.4% |
| Median | 23.4% | 13.5% |
| Interquartile 25% (IQ1) | 16.0% | 11.7% |
| Interquartile 75% (IQ3) | 49.3% | 16.6% |
| Interquartile Range (IQR) | 33.3% | 4.9% |
| Standard Deviation (Sample) | 21.8% | 4.9% |
| Standard Deviation (Population) | 21.6% | 4.8% |
Similar Demographics by Unemployment Among Youth under 25 years
Demographics Similar to Inupiat by Unemployment Among Youth under 25 years
In terms of unemployment among youth under 25 years, the demographic groups most similar to Inupiat are Hopi (21.5%, a difference of 2.5%), Yup'ik (23.7%, a difference of 8.0%), Crow (20.1%, a difference of 9.6%), Navajo (18.6%, a difference of 18.1%), and Puerto Rican (18.4%, a difference of 19.5%).
| Demographics | Rating | Rank | Unemployment Among Youth under 25 years |
| Guyanese | 0.0 /100 | #333 | Tragic 15.9% |
| Immigrants | Guyana | 0.0 /100 | #334 | Tragic 15.9% |
| Immigrants | St. Vincent and the Grenadines | 0.0 /100 | #335 | Tragic 16.1% |
| Pima | 0.0 /100 | #336 | Tragic 16.2% |
| Arapaho | 0.0 /100 | #337 | Tragic 16.3% |
| Yuman | 0.0 /100 | #338 | Tragic 16.3% |
| Tsimshian | 0.0 /100 | #339 | Tragic 16.5% |
| Colville | 0.0 /100 | #340 | Tragic 16.8% |
| Paiute | 0.0 /100 | #341 | Tragic 17.6% |
| Puerto Ricans | 0.0 /100 | #342 | Tragic 18.4% |
| Navajo | 0.0 /100 | #343 | Tragic 18.6% |
| Crow | 0.0 /100 | #344 | Tragic 20.1% |
| Hopi | 0.0 /100 | #345 | Tragic 21.5% |
| Inupiat | 0.0 /100 | #346 | Tragic 22.0% |
| Yup'ik | 0.0 /100 | #347 | Tragic 23.7% |
Demographics Similar to Immigrants from Haiti by Unemployment Among Youth under 25 years
In terms of unemployment among youth under 25 years, the demographic groups most similar to Immigrants from Haiti are Immigrants from Belize (14.0%, a difference of 0.38%), Pueblo (13.9%, a difference of 0.49%), Haitian (13.9%, a difference of 0.56%), Belizean (13.8%, a difference of 0.89%), and Houma (13.8%, a difference of 0.89%).
| Demographics | Rating | Rank | Unemployment Among Youth under 25 years |
| Immigrants | Cabo Verde | 0.0 /100 | #300 | Tragic 13.8% |
| Immigrants | Senegal | 0.0 /100 | #301 | Tragic 13.8% |
| Immigrants | Sierra Leone | 0.0 /100 | #302 | Tragic 13.8% |
| Belizeans | 0.0 /100 | #303 | Tragic 13.8% |
| Houma | 0.0 /100 | #304 | Tragic 13.8% |
| Haitians | 0.0 /100 | #305 | Tragic 13.9% |
| Pueblo | 0.0 /100 | #306 | Tragic 13.9% |
| Immigrants | Haiti | 0.0 /100 | #307 | Tragic 14.0% |
| Immigrants | Belize | 0.0 /100 | #308 | Tragic 14.0% |
| Aleuts | 0.0 /100 | #309 | Tragic 14.1% |
| Immigrants | West Indies | 0.0 /100 | #310 | Tragic 14.2% |
| Immigrants | Bangladesh | 0.0 /100 | #311 | Tragic 14.2% |
| Vietnamese | 0.0 /100 | #312 | Tragic 14.3% |
| Immigrants | Armenia | 0.0 /100 | #313 | Tragic 14.4% |
| Jamaicans | 0.0 /100 | #314 | Tragic 14.4% |