Indonesian vs Immigrants from Albania Unemployment Among Women with Children Under 18 years

COMPARE

Indonesian
Race
Ancestry
AfghanAfricanAlaska NativeAlaskan AthabascanAlbanianAleutAlsatianAmericanApacheArabArapahoArgentineanArmenianAssyrian/Chaldean/SyriacAustralianAustrianBahamianBangladeshiBarbadianBasqueBelgianBelizeanBermudanBhutaneseBlackfeetBolivianBrazilianBritishBritish West IndianBulgarianBurmeseCajunCambodianCanadianCape VerdeanCarpatho RusynCelticCentral AmericanCentral American IndianCherokeeCheyenneChickasawChileanChineseChippewaChoctawColombianColvilleComancheCosta RicanCreeCreekCroatianCrowCubanCypriotCzechCzechoslovakianDanishDelawareDominicanDutchDutch West IndianEastern EuropeanEcuadorianEgyptianEnglishEstonianEthiopianEuropeanFijianFilipinoFinnishFrenchFrench American IndianFrench CanadianGermanGerman RussianGhanaianGreekGuamanian/ChamorroGuatemalanGuyaneseHaitianHmongHonduranHopiHoumaHungarianIcelanderIndian (Asian)IndonesianInupiatIranianIraqiIrishIroquoisIsraeliItalianJamaicanJapaneseJordanianKenyanKiowaKoreanLaotianLatvianLebaneseLiberianLithuanianLumbeeLuxembourgerMacedonianMalaysianMalteseMarshalleseMenomineeMexicanMexican American IndianMongolianMoroccanNative HawaiianNavajoNepaleseNew ZealanderNicaraguanNigerianNorthern EuropeanNorwegianOkinawanOsageOttawaPaiutePakistaniPalestinianPanamanianParaguayanPennsylvania GermanPeruvianPimaPolishPortuguesePotawatomiPuebloPuerto RicanPuget Sound SalishRomanianRussianSalvadoranSamoanScandinavianScotch-IrishScottishSeminoleSenegaleseSerbianShoshoneSierra LeoneanSiouxSlavicSlovakSloveneSomaliSouth AfricanSouth AmericanSouth American IndianSoviet UnionSpaniardSpanishSpanish AmericanSpanish American IndianSri LankanSubsaharan AfricanSudaneseSwedishSwissSyrianTaiwaneseThaiTlingit-HaidaTohono O'OdhamTonganTrinidadian and TobagonianTsimshianTurkishU.S. Virgin IslanderUgandanUkrainianUruguayanUteVenezuelanVietnameseWelshWest IndianYakamaYaquiYugoslavianYumanYup'ikZimbabwean
Immigration
NonimmigrantsImmigrantsAfghanistanAfricaArgentinaArmeniaAsiaAustraliaAustriaBahamasBangladeshBarbadosBelarusBelgiumBelizeBoliviaBosnia and HerzegovinaBrazilBulgariaBurma/MyanmarCabo VerdeCambodiaCameroonCanadaCaribbeanCentral AmericaChileChinaColombiaCongoCosta RicaCroatiaCubaCzechoslovakiaDenmarkDominicaDominican RepublicEastern AfricaEastern AsiaEastern EuropeEcuadorEgyptEl SalvadorEnglandEritreaEthiopiaEuropeFijiFranceGermanyGhanaGreeceGrenadaGuatemalaGuyanaHaitiHondurasHong KongHungaryIndiaIndonesiaIranIraqIrelandIsraelItalyJamaicaJapanJordanKazakhstanKenyaKoreaKuwaitLaosLatin AmericaLatviaLebanonLiberiaLithuaniaMalaysiaMexicoMicronesiaMiddle AfricaMoldovaMoroccoNepalNetherlandsNicaraguaNigeriaNorth AmericaNorth MacedoniaNorthern AfricaNorthern EuropeNorwayOceaniaPakistanPanamaPeruPhilippinesPolandPortugalRomaniaRussiaSaudi ArabiaScotlandSenegalSerbiaSierra LeoneSingaporeSomaliaSouth AfricaSouth AmericaSouth Central AsiaSouth Eastern AsiaSouthern EuropeSpainSri LankaSt. Vincent and the GrenadinesSudanSwedenSwitzerlandSyriaTaiwanThailandTrinidad and TobagoTurkeyUgandaUkraineUruguayUzbekistanVenezuelaVietnamWest IndiesWestern AfricaWestern AsiaWestern EuropeYemenZaireZimbabweAzores
Immigrants from Albania
Race
Ancestry
AfghanAfricanAlaska NativeAlaskan AthabascanAlbanianAleutAlsatianAmericanApacheArabArapahoArgentineanArmenianAssyrian/Chaldean/SyriacAustralianAustrianBahamianBangladeshiBarbadianBasqueBelgianBelizeanBermudanBhutaneseBlackfeetBolivianBrazilianBritishBritish West IndianBulgarianBurmeseCajunCambodianCanadianCape VerdeanCarpatho RusynCelticCentral AmericanCentral American IndianCherokeeCheyenneChickasawChileanChineseChippewaChoctawColombianColvilleComancheCosta RicanCreeCreekCroatianCrowCubanCypriotCzechCzechoslovakianDanishDelawareDominicanDutchDutch West IndianEastern EuropeanEcuadorianEgyptianEnglishEstonianEthiopianEuropeanFijianFilipinoFinnishFrenchFrench American IndianFrench CanadianGermanGerman RussianGhanaianGreekGuamanian/ChamorroGuatemalanGuyaneseHaitianHmongHonduranHopiHoumaHungarianIcelanderIndian (Asian)InupiatIranianIraqiIrishIroquoisIsraeliItalianJamaicanJapaneseJordanianKenyanKiowaKoreanLaotianLatvianLebaneseLiberianLithuanianLumbeeLuxembourgerMacedonianMalaysianMalteseMarshalleseMenomineeMexicanMexican American IndianMongolianMoroccanNative HawaiianNavajoNepaleseNew ZealanderNicaraguanNigerianNorthern EuropeanNorwegianOkinawanOsageOttawaPaiutePakistaniPalestinianPanamanianParaguayanPennsylvania GermanPeruvianPimaPolishPortuguesePotawatomiPuebloPuerto RicanPuget Sound SalishRomanianRussianSalvadoranSamoanScandinavianScotch-IrishScottishSeminoleSenegaleseSerbianShoshoneSierra LeoneanSiouxSlavicSlovakSloveneSomaliSouth AfricanSouth AmericanSouth American IndianSoviet UnionSpaniardSpanishSpanish AmericanSpanish American IndianSri LankanSubsaharan AfricanSudaneseSwedishSwissSyrianTaiwaneseThaiTlingit-HaidaTohono O'OdhamTonganTrinidadian and TobagonianTsimshianTurkishU.S. Virgin IslanderUgandanUkrainianUruguayanUteVenezuelanVietnameseWelshWest IndianYakamaYaquiYugoslavianYumanYup'ikZimbabwean
Immigration
NonimmigrantsImmigrantsAfghanistanAfricaAlbaniaArgentinaArmeniaAsiaAustraliaAustriaBahamasBangladeshBarbadosBelarusBelgiumBelizeBoliviaBosnia and HerzegovinaBrazilBulgariaBurma/MyanmarCabo VerdeCambodiaCameroonCanadaCaribbeanCentral AmericaChileChinaColombiaCongoCosta RicaCroatiaCubaCzechoslovakiaDenmarkDominicaDominican RepublicEastern AfricaEastern AsiaEastern EuropeEcuadorEgyptEl SalvadorEnglandEritreaEthiopiaEuropeFijiFranceGermanyGhanaGreeceGrenadaGuatemalaGuyanaHaitiHondurasHong KongHungaryIndiaIndonesiaIranIraqIrelandIsraelItalyJamaicaJapanJordanKazakhstanKenyaKoreaKuwaitLaosLatin AmericaLatviaLebanonLiberiaLithuaniaMalaysiaMexicoMicronesiaMiddle AfricaMoldovaMoroccoNepalNetherlandsNicaraguaNigeriaNorth AmericaNorth MacedoniaNorthern AfricaNorthern EuropeNorwayOceaniaPakistanPanamaPeruPhilippinesPolandPortugalRomaniaRussiaSaudi ArabiaScotlandSenegalSerbiaSierra LeoneSingaporeSomaliaSouth AfricaSouth AmericaSouth Central AsiaSouth Eastern AsiaSouthern EuropeSpainSri LankaSt. Vincent and the GrenadinesSudanSwedenSwitzerlandSyriaTaiwanThailandTrinidad and TobagoTurkeyUgandaUkraineUruguayUzbekistanVenezuelaVietnamWest IndiesWestern AfricaWestern AsiaWestern EuropeYemenZaireZimbabweAzores
Unemployment Among Women with Children Under 18 years
Income
Poverty
Unemployment
Labor Participation
Family Structure
Vehicle Availability
Education Level
Disability

Unemployment Among Women with Children Under 18 years Comparison

Indonesians

Immigrants from Albania

Fair
Exceptional
5.5%
UNEMPLOYMENT AMONG WOMEN WITH CHILDREN UNDER 18 YEARS
36.3/ 100
METRIC RATING
186th/ 347
METRIC RANK
5.2%
UNEMPLOYMENT AMONG WOMEN WITH CHILDREN UNDER 18 YEARS
92.2/ 100
METRIC RATING
96th/ 347
METRIC RANK

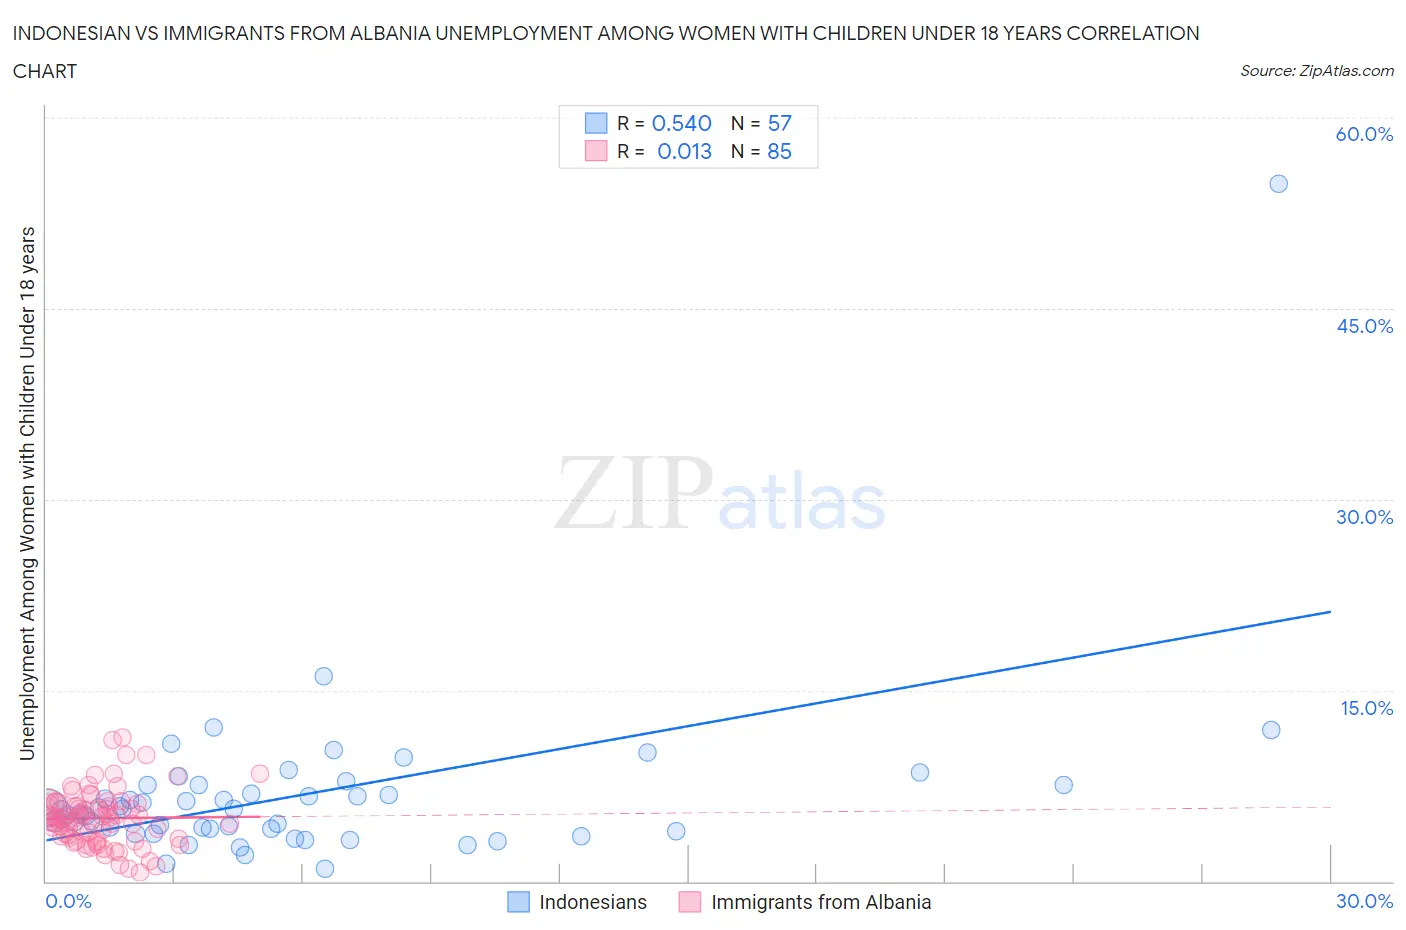
Indonesian vs Immigrants from Albania Unemployment Among Women with Children Under 18 years Correlation Chart

The statistical analysis conducted on geographies consisting of 160,707,553 people shows a substantial positive correlation between the proportion of Indonesians and unemployment rate among women with children under the age of 18 in the United States with a correlation coefficient (R) of 0.540 and weighted average of 5.5%. Similarly, the statistical analysis conducted on geographies consisting of 117,672,855 people shows no correlation between the proportion of Immigrants from Albania and unemployment rate among women with children under the age of 18 in the United States with a correlation coefficient (R) of 0.013 and weighted average of 5.2%, a difference of 5.6%.
Indonesian vs Immigrants from Albania Unemployment Among Women with Children Under 18 years

Unemployment Among Women with Children Under 18 years Correlation Summary

MeasurementIndonesianImmigrants from Albania
Minimum1.0%0.70%
Maximum54.8%11.3%
Range53.8%10.6%
Mean6.8%5.0%
Median5.7%4.9%
Interquartile 25% (IQ1)4.0%3.4%
Interquartile 75% (IQ3)7.6%6.0%
Interquartile Range (IQR)3.6%2.7%
Standard Deviation (Sample)7.1%2.1%
Standard Deviation (Population)7.0%2.1%

Similar Demographics by Unemployment Among Women with Children Under 18 years

Demographics Similar to Indonesians by Unemployment Among Women with Children Under 18 years

In terms of unemployment among women with children under 18 years, the demographic groups most similar to Indonesians are Malaysian (5.5%, a difference of 0.050%), Iraqi (5.5%, a difference of 0.080%), Immigrants from Zaire (5.5%, a difference of 0.13%), Immigrants from Cambodia (5.5%, a difference of 0.15%), and Immigrants from Laos (5.5%, a difference of 0.18%).
DemographicsRating | RankUnemployment Among Women with Children Under 18 years
Syrians
42.8
/100
|
#179
Average
5.5%
Immigrants | Southern Europe
42.7
/100
|
#180
Average
5.5%
Immigrants | Hungary
41.3
/100
|
#181
Average
5.5%
Immigrants | Sudan
40.6
/100
|
#182
Average
5.5%
Immigrants | Laos
38.8
/100
|
#183
Fair
5.5%
Immigrants | Cambodia
38.4
/100
|
#184
Fair
5.5%
Immigrants | Zaire
38.1
/100
|
#185
Fair
5.5%
Indonesians
36.3
/100
|
#186
Fair
5.5%
Malaysians
35.7
/100
|
#187
Fair
5.5%
Iraqis
35.3
/100
|
#188
Fair
5.5%
Immigrants | Eritrea
33.8
/100
|
#189
Fair
5.5%
Immigrants | Poland
31.2
/100
|
#190
Fair
5.5%
South American Indians
30.8
/100
|
#191
Fair
5.5%
Immigrants | Spain
30.7
/100
|
#192
Fair
5.5%
Immigrants | Afghanistan
29.3
/100
|
#193
Fair
5.5%

Demographics Similar to Immigrants from Albania by Unemployment Among Women with Children Under 18 years

In terms of unemployment among women with children under 18 years, the demographic groups most similar to Immigrants from Albania are Palestinian (5.2%, a difference of 0.0%), Immigrants from North America (5.2%, a difference of 0.020%), Immigrants from Vietnam (5.2%, a difference of 0.040%), Cuban (5.2%, a difference of 0.10%), and Immigrants from Kuwait (5.2%, a difference of 0.11%).
DemographicsRating | RankUnemployment Among Women with Children Under 18 years
Immigrants | Turkey
94.2
/100
|
#89
Exceptional
5.2%
Ukrainians
93.8
/100
|
#90
Exceptional
5.2%
Immigrants | Zimbabwe
93.6
/100
|
#91
Exceptional
5.2%
Immigrants | Pakistan
93.3
/100
|
#92
Exceptional
5.2%
Immigrants | Canada
93.3
/100
|
#93
Exceptional
5.2%
Immigrants | Kuwait
92.6
/100
|
#94
Exceptional
5.2%
Immigrants | North America
92.3
/100
|
#95
Exceptional
5.2%
Immigrants | Albania
92.2
/100
|
#96
Exceptional
5.2%
Palestinians
92.2
/100
|
#97
Exceptional
5.2%
Immigrants | Vietnam
92.0
/100
|
#98
Exceptional
5.2%
Cubans
91.8
/100
|
#99
Exceptional
5.2%
Immigrants | Greece
91.4
/100
|
#100
Exceptional
5.2%
Immigrants | Netherlands
91.0
/100
|
#101
Exceptional
5.2%
Immigrants | Cuba
90.9
/100
|
#102
Exceptional
5.2%
Sri Lankans
90.3
/100
|
#103
Exceptional
5.2%