Immigrants vs Ottawa Unemployment Among Women with Children Under 18 years
COMPARE
Immigrants
Ottawa
Unemployment Among Women with Children Under 18 years
Unemployment Among Women with Children Under 18 years Comparison
Immigrants
Ottawa
5.8%
UNEMPLOYMENT AMONG WOMEN WITH CHILDREN UNDER 18 YEARS
2.0/ 100
METRIC RATING
240th/ 347
METRIC RANK
6.1%
UNEMPLOYMENT AMONG WOMEN WITH CHILDREN UNDER 18 YEARS
0.1/ 100
METRIC RATING
259th/ 347
METRIC RANK
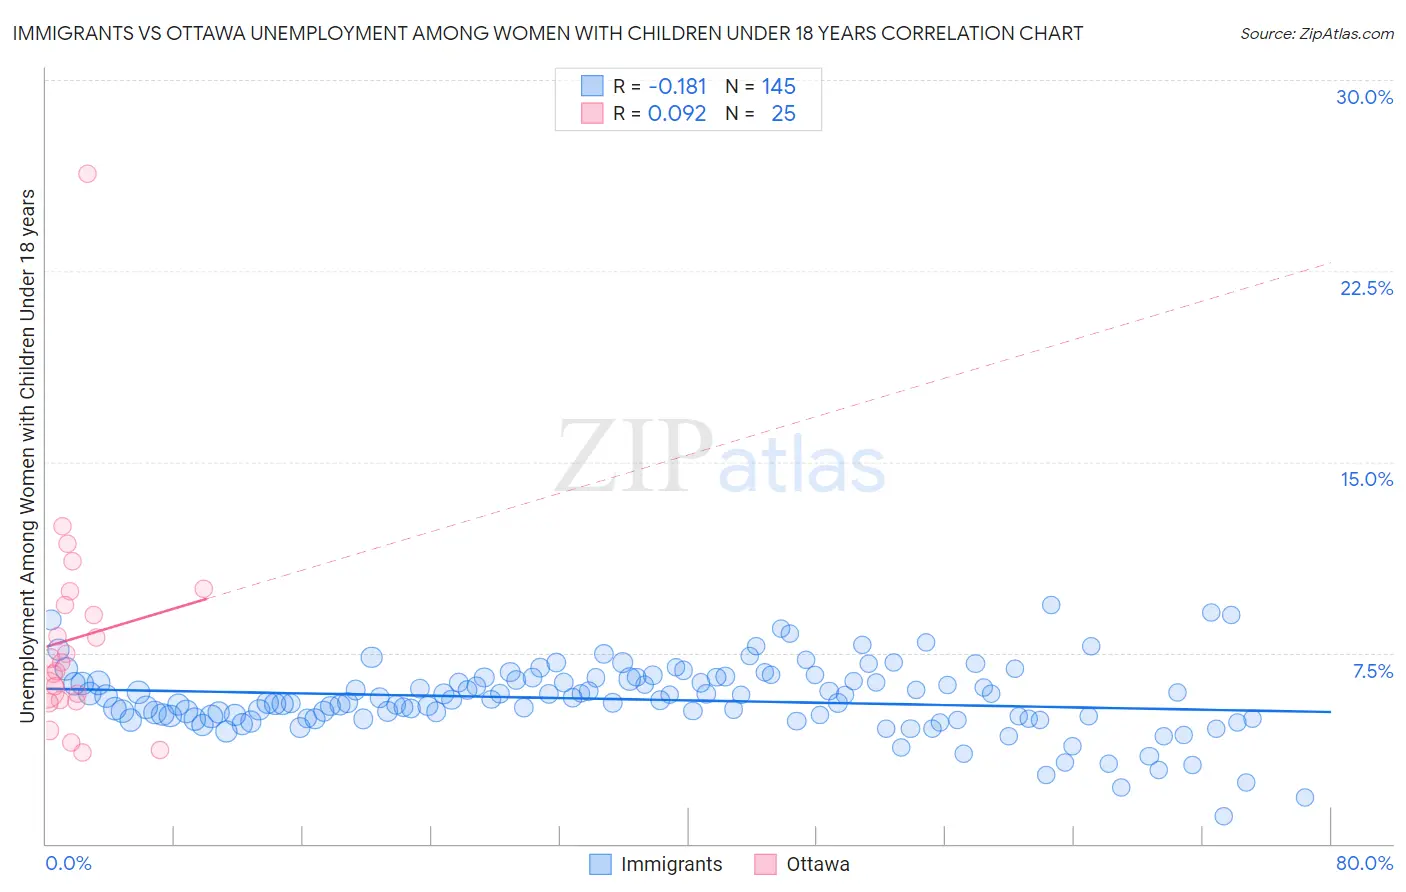
Immigrants vs Ottawa Unemployment Among Women with Children Under 18 years Correlation Chart
The statistical analysis conducted on geographies consisting of 521,116,845 people shows a poor negative correlation between the proportion of Immigrants and unemployment rate among women with children under the age of 18 in the United States with a correlation coefficient (R) of -0.181 and weighted average of 5.8%. Similarly, the statistical analysis conducted on geographies consisting of 49,047,550 people shows a slight positive correlation between the proportion of Ottawa and unemployment rate among women with children under the age of 18 in the United States with a correlation coefficient (R) of 0.092 and weighted average of 6.1%, a difference of 5.3%.
Unemployment Among Women with Children Under 18 years Correlation Summary
| Measurement | Immigrants | Ottawa |
| Minimum | 1.1% | 3.6% |
| Maximum | 9.4% | 26.3% |
| Range | 8.3% | 22.7% |
| Mean | 5.7% | 8.1% |
| Median | 5.6% | 7.1% |
| Interquartile 25% (IQ1) | 4.9% | 5.6% |
| Interquartile 75% (IQ3) | 6.5% | 9.6% |
| Interquartile Range (IQR) | 1.6% | 4.0% |
| Standard Deviation (Sample) | 1.4% | 4.5% |
| Standard Deviation (Population) | 1.4% | 4.4% |
Demographics Similar to Immigrants and Ottawa by Unemployment Among Women with Children Under 18 years
In terms of unemployment among women with children under 18 years, the demographic groups most similar to Immigrants are Immigrants from Sierra Leone (5.8%, a difference of 0.0%), Brazilian (5.8%, a difference of 0.46%), Moroccan (5.9%, a difference of 0.69%), Immigrants from Uruguay (5.9%, a difference of 0.98%), and Choctaw (5.9%, a difference of 1.0%). Similarly, the demographic groups most similar to Ottawa are Immigrants from Nigeria (6.1%, a difference of 0.67%), Bermudan (6.1%, a difference of 0.86%), Nepalese (6.0%, a difference of 1.4%), Liberian (6.0%, a difference of 1.5%), and Immigrants from the Azores (6.0%, a difference of 1.9%).
| Demographics | Rating | Rank | Unemployment Among Women with Children Under 18 years |
| Immigrants | Sierra Leone | 2.0 /100 | #239 | Tragic 5.8% |
| Immigrants | Immigrants | 2.0 /100 | #240 | Tragic 5.8% |
| Brazilians | 1.6 /100 | #241 | Tragic 5.8% |
| Moroccans | 1.4 /100 | #242 | Tragic 5.9% |
| Immigrants | Uruguay | 1.1 /100 | #243 | Tragic 5.9% |
| Choctaw | 1.1 /100 | #244 | Tragic 5.9% |
| Ugandans | 1.1 /100 | #245 | Tragic 5.9% |
| Uruguayans | 1.0 /100 | #246 | Tragic 5.9% |
| Cape Verdeans | 1.0 /100 | #247 | Tragic 5.9% |
| Delaware | 0.8 /100 | #248 | Tragic 5.9% |
| Immigrants | Cameroon | 0.8 /100 | #249 | Tragic 5.9% |
| Immigrants | Cabo Verde | 0.7 /100 | #250 | Tragic 5.9% |
| Ute | 0.7 /100 | #251 | Tragic 5.9% |
| Seminole | 0.5 /100 | #252 | Tragic 6.0% |
| Immigrants | Congo | 0.4 /100 | #253 | Tragic 6.0% |
| Immigrants | Azores | 0.3 /100 | #254 | Tragic 6.0% |
| Liberians | 0.2 /100 | #255 | Tragic 6.0% |
| Nepalese | 0.2 /100 | #256 | Tragic 6.0% |
| Bermudans | 0.1 /100 | #257 | Tragic 6.1% |
| Immigrants | Nigeria | 0.1 /100 | #258 | Tragic 6.1% |
| Ottawa | 0.1 /100 | #259 | Tragic 6.1% |